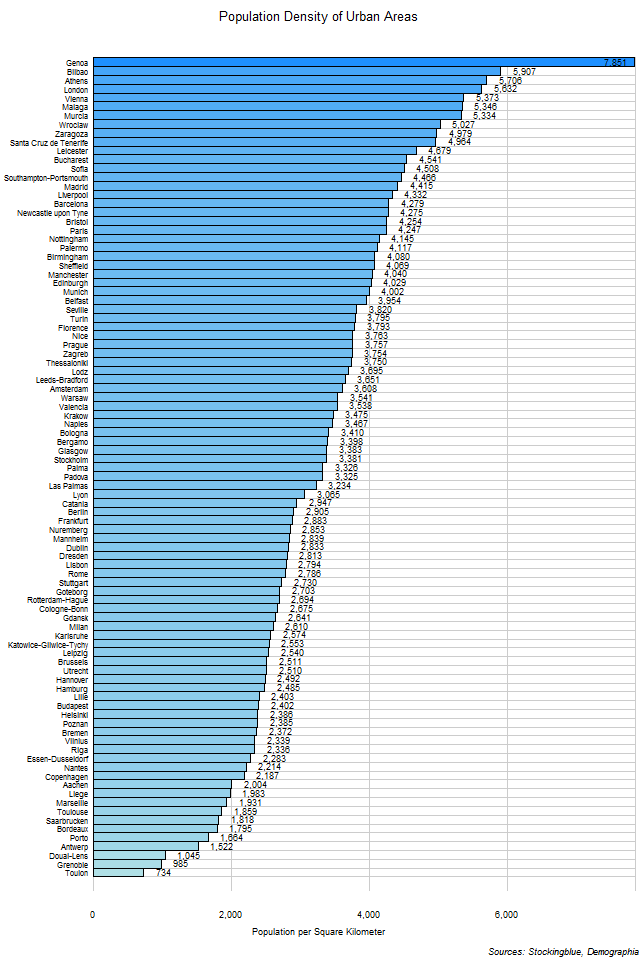
The chart above shows the population density of each urban area with a population of over 500,000. The urban areas have been normalized so as to avoid any inconsistencies with how cities and their metropolitan areas are defined by their governments. Each urban area has similar characteristics making this the definitive method with which to compare cities across various countries. Genoa has the largest population density by far in the EU.
Findings
- The difference between the urban area with the greatest population density, Genoa, and the urban area with the least, Toulon, is 7,117 people per square kilometer (18,432 people per square mile).
- Genoa has 10.70 times the population density that Toulon does.
- The median population density of urban areas with a minimum population of 500,000 in the 28 EU states is 3,326 people per square kilometer (8,614 people per square mile) and the mean 3,338.69 people per square kilometer (8,647 people per square mile).
Caveats
- Data is from 2020.
- The methodology for how these urban areas have been defined can be found in the source link below. As of this writing this is the most reliable way to compare urban areas throughout the world.
- All figures are rounded to the nearest whole.
Details
Only 22 of the 28 EU states have urban areas with at least 500,000 people. Of these, Germany has 16; the United Kingdom has 14; France, Italy, and Spain each have 11; Poland has seven; Belgium and the Netherlands each have three; Greece, Portugal, and Sweden each have two; and Austria, Bulgaria, Croatia, Czechia, Denmark, Finland, Hungary, Ireland, Latvia, Lithuania, and Romania each have one.
Five urban areas with a population of over 500,000 people have a population density of over 5,000 people per square kilometer (12,950 people per square mile). Two have a population density of less than 1,000 people per square kilometer (2,590 people per square mile).
Austria has the largest mean population density in its urban areas of over 500,000 people with a mean of 5,373 people per square kilometer (13,916 people per square mile) distributed among its one urban area. Greece follows with 4,728 people per square kilometer (12,245 people per square mile) among its two urban areas. They are followed by Romania (4,541 people per square kilometer), Bulgaria (4,508), Spain (4,467), the United Kingdom (4,214), Italy (3,773), Czechia (3,757), Croatia (3,754), Poland (3,331), Sweden (3,042), the Netherlands (2,937), Ireland (2,833), Germany (2,642), Hungary (2,402), Finland (2,386), Lithuania (2,339), Latvia (2,336), Portugal (2,229), Denmark (2,187), France (2,186), and Belgium (2,005).
Austria has the largest median population density in its urban areas of over 500,000 people with a median of 5,373 people per square kilometer (13,916 people per square mile) distributed among its one urban area. Greece follows with 4,728 people per square kilometer (12,245 people per square mile) among its two urban areas. They are followed by Romania (4,541 people per square kilometer), Bulgaria (4,508), Spain (4,415), the United Kingdom (4,112), Czechia (3,757), Croatia (3,754), Poland (3,475), Italy (3,410), Sweden (3,042), Ireland (2,833), the Netherlands (2,694), Germany (2,624), Hungary (2,402), Finland (2,386), Lithuania (2,339), Latvia (2,336), Portugal (2,229), Denmark (2,187), Belgium (2,005), and France (1,931).
Cyprus, Estonia, Luxembourg, Malta, Slovakia, and Slovenia do not have any urban areas with a population of over 500,000 inhabitants.
Data
| State | Mean Density | Median Area | Number of Large Urban Areas |
|---|---|---|---|
| Austria | 5,373 | 5,373 | 1 |
| Belgium | 2,005 | 1,983 | 3 |
| Bulgaria | 4,508 | 4,508 | 1 |
| Croatia | 3,754 | 3,754 | 1 |
| Czech Republic | 3,757 | 3,757 | 1 |
| Denmark | 2,187 | 2,187 | 1 |
| Finland | 2,386 | 2,386 | 1 |
| France | 2,186 | 1,931 | 11 |
| Germany | 2,642 | 2,624.5 | 16 |
| Greece | 4,728 | 4,728 | 2 |
| Hungary | 2,402 | 2,402 | 1 |
| Ireland | 2,833 | 2,833 | 1 |
| Italy | 3,773 | 3,410 | 11 |
| Latvia | 2,336 | 2,336 | 1 |
| Lithuania | 2,339 | 2,339 | 1 |
| Netherlands | 2,937 | 2,694 | 3 |
| Poland | 3,331 | 3,475 | 7 |
| Portugal | 2,229 | 2,229 | 2 |
| Romania | 4,541 | 4,541 | 1 |
| Spain | 4,467 | 4,415 | 11 |
| Sweden | 3,042 | 3,042 | 2 |
| United Kingdom | 4,214 | 4,112.5 | 14 |
Sources
Demographia. 2021. "Demographia World Urban Areas: 16th Annual Edition." Accessed March 9, 2021. http://demographia.com/db-worldua.pdf.