The Correlation between GDP PPP Per Capita and GDP PPP Per Area Worldwide
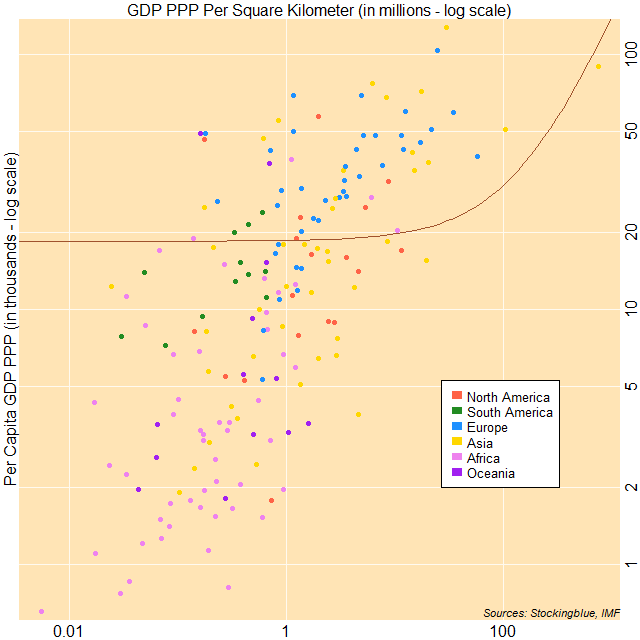
The correlation between per capita gross domestic product based on purchasing power parity (GDP PPP) and GDP PPP per area worldwide is moderately weak. The three largest economies on a per capita basis have a high per area GDP relative to other countries.
The Correlation between GDP PPP Per Capita and GDP PPP Per Area in Oceania
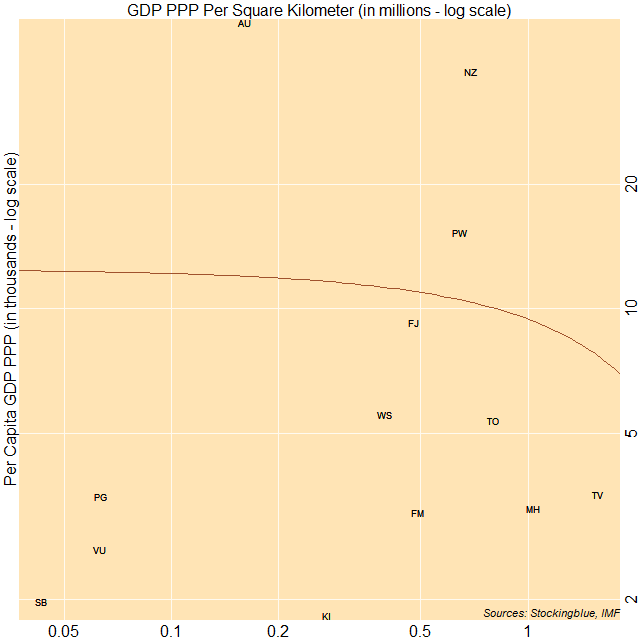
The correlation between per capita gross domestic product based on purchasing power parity (GDP PPP) and GDP PPP per area in Oceania is weak. The three largest economies on a per capita basis have either a moderate or high per area GDP relative to other countries on the continent.
The Correlation between GDP PPP Per Capita and GDP PPP Per Area in Africa
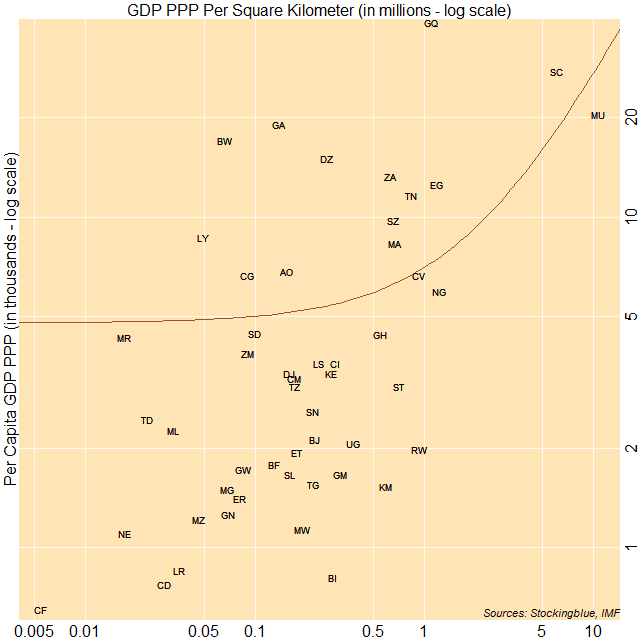
The correlation between per capita gross domestic product based on purchasing power parity (GDP PPP) and GDP PPP per area in Africa is moderate. The three largest economies on a per capita basis all have a high per area GDP relative to other countries on the continent.
The Correlation between GDP PPP Per Capita and GDP PPP Per Area in Asia
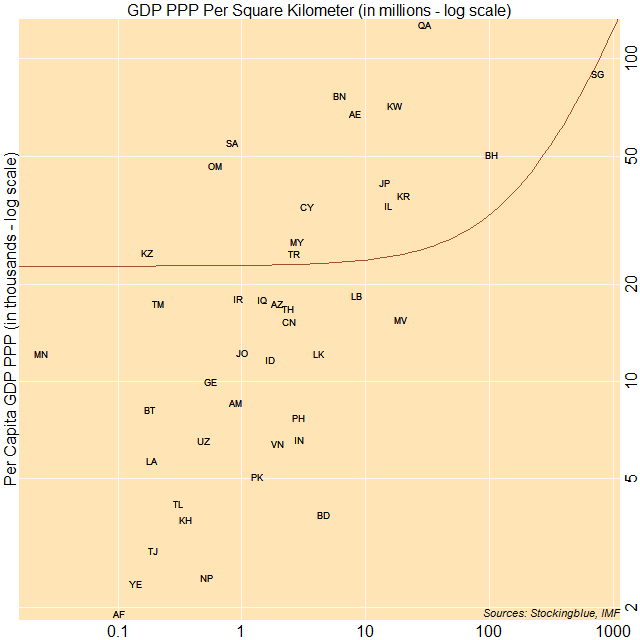
The correlation between per capita gross domestic product based on purchasing power parity (GDP PPP) and GDP PPP per area in Asia is moderate. The three largest economies on a per capita basis have either a moderate or high per area GDP relative to other countries on the continent.
The Correlation between GDP PPP Per Capita and GDP PPP Per Area in Europe
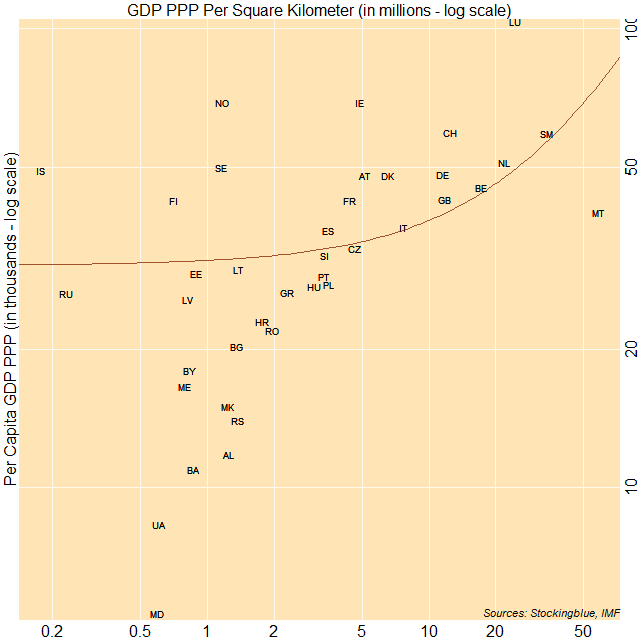
The correlation between per capita gross domestic product based on purchasing power parity (GDP PPP) and GDP PPP per area in Europe is moderate. The three largest economies on a per capita basis have either a low, moderate, or high per area GDP relative to other countries on the continent.
The Correlation between GDP PPP Per Capita and GDP PPP Per Area in South America
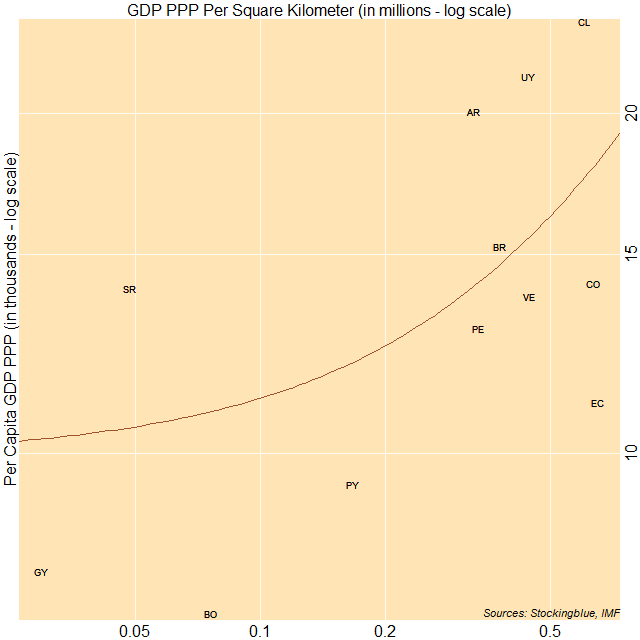
The correlation between per capita gross domestic product based on purchasing power parity (GDP PPP) and GDP PPP per area in South America is moderately strong. The three largest economies on a per capita basis have either a moderate or high per area GDP relative to other countries on the continent.
The Correlation between GDP PPP Per Capita and GDP PPP Per Area in North America
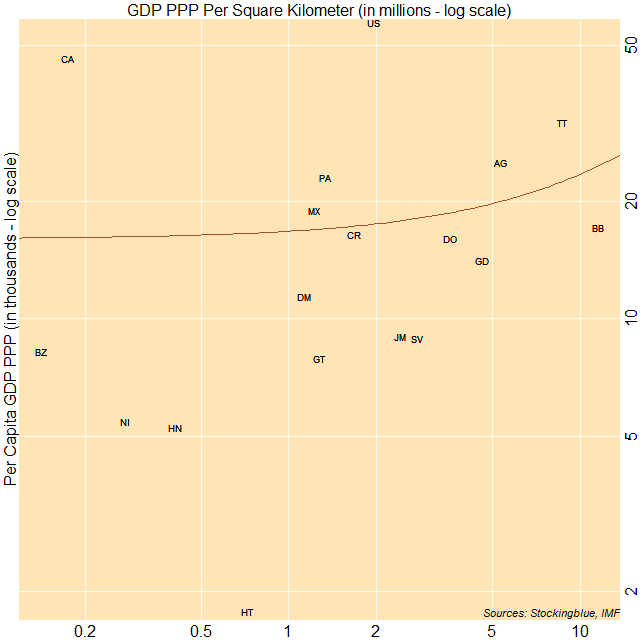
The correlation between per capita gross domestic product based on purchasing power parity (GDP PPP) and GDP PPP per area in North America is almost nonexistent. The three largest economies on a per capita basis have either a very low, moderate, or high per area GDP.
The Correlation between Minimum Wage and Shadow Economies Worldwide
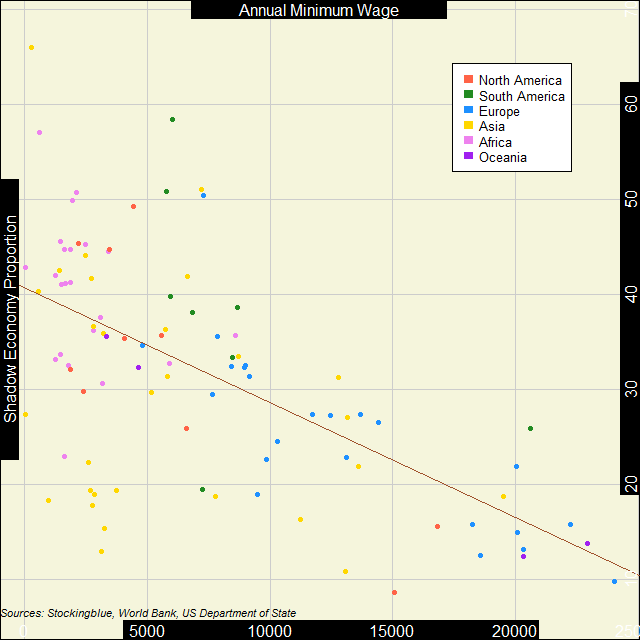
Worldwide, the inverse correlation between the strength of the shadow economy and the minimum wage is pretty strong. As the proportion of the shadow economy decreases, the minimum wage tends to go up.
The Correlation between Minimum Wage and Shadow Economies in Oceania
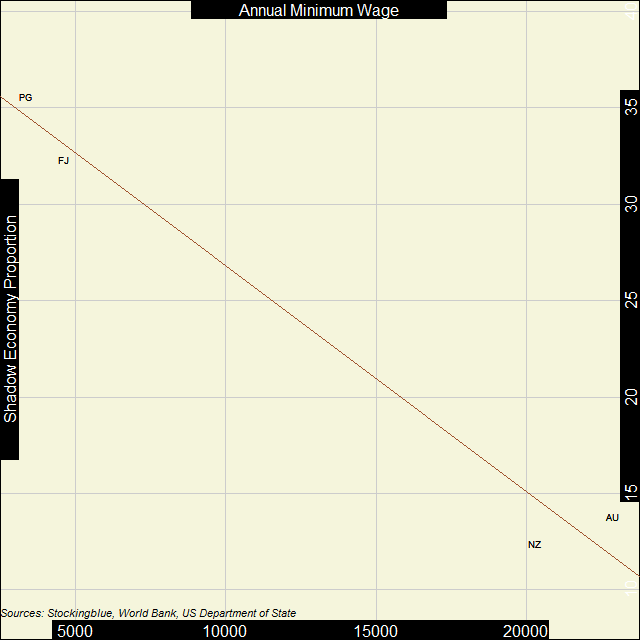
In Oceania, the inverse correlation between the strength of the shadow economy and the minimum wage is extremely strong. However, the sample size if four countries so it needs more data.
The Correlation between Minimum Wage and Shadow Economies in Africa
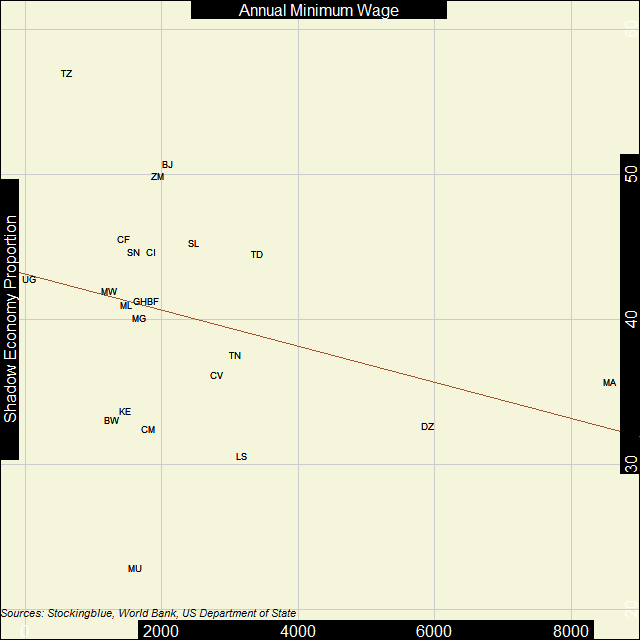
In Africa, the inverse correlation between the strength of the shadow economy and the minimum wage is very weak. There is no real relationship between the strength of the shadow economy and minimum wage.
Older