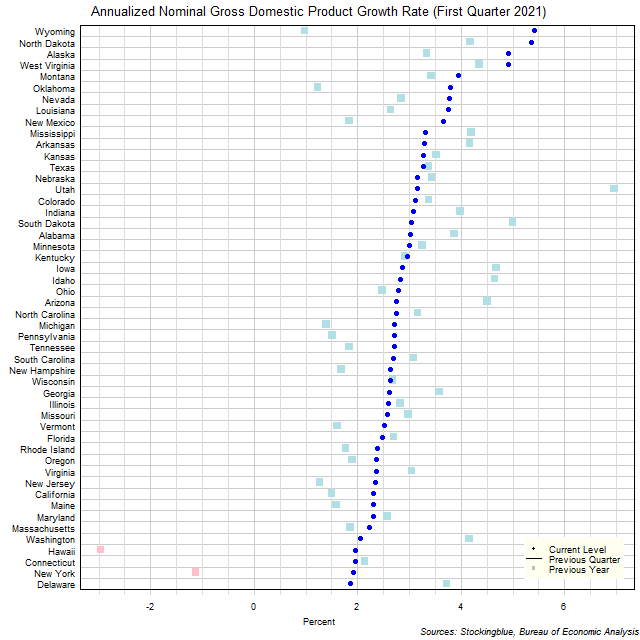
The chart above shows the annualized nominal gross domestic product (GDP) quarterly growth rate in each US state as of the first quarter of 2021 and the growth rate from one year prior. Every single state's economy grew over the previous quarter.
Findings
- The difference between the state with the largest annualized quarterly growth rate, Wyoming, and the state with the smallest, Delaware, is 3.57 percentage points.
- The difference between the state with the largest year-over-year growth rate, Utah, and the state with the smallest, Hawaii, is 9.92 percentage points.
- The median annualized quarterly growth rate in the 50 US states is 2.75% and the mean 2.97%.
- The median year-over-year growth rate in the 50 US states is 2.95% and the mean 2.79%.
- Of the 50 states, 24 grew faster over the previous quarter than they did over the same quarter last year, 0 grew at the same rate over both time periods, and 26 grew slower over the previous quarter than they did over the same quarter last year.
Caveats
- Data is from the first quarter of 2020, the fourth quarter of 2020, and the first quarter of 2021.
- The data is seasonally adjusted in current dollars.
- Growth rates may differ from those provided by the Bureau of Economic Analysis as the BEA's growth rates are based on chained dollars in conjunction with the chain index or the quality index for real GDP.
- All figures are rounded to the nearest hundredth.
Details
Delaware had the worst performance over the previous quarter with an annualized rate of 1.85%. Wyoming had the best performance with an annualized rate of 5.42%.
Year over year, Hawaii had the worst performance with an annualized rate of -2.96% while Utah had the best performance with an annualized rate of 6.96%.
Utah had the worst change in its growth rate between its year-over-year growth and its annualized quarterly growth slowing its rate by 3.81 percentage points. Hawaii had the best change in its growth rate between its year-over-year growth and its annualized quarterly growth raising its rate by 4.92 percentage points.
Wyoming (from 48th best growth rate over the same quarter last year to the 1st best growth rate over the previous quarter) rose 47 spots. Conversely, Delaware (from 13th to 50th) fell 37 spots. Only three states had growth rates in the top ten both over the same quarter last year and over the previous quarter: North Dakota (8th highest growth year-over year, 2nd highest growth over the previous quarter), West Virginia (6th highest year-over-year, 4th highest quarterly), and Mississippi (7th highest year-over-year, 10th highest quarterly). Two states had growth rates in the bottom five both over the same quarter last year and over the previous quarter: Hawaii (50th highest year-over-year, 47th highest quarterly) and New York (49th highest year-over-year, 49th highest quarterly).
Sources
US Bureau of Economic Analysis. 2021. "GDP by State." Accessed July 20, 2021. https://www.bea.gov/data/gdp/gdp-state.