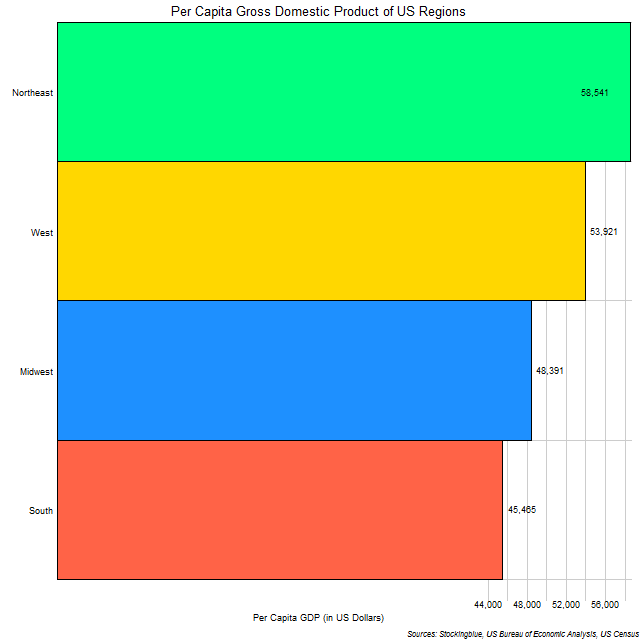
The chart above shows the per capita GDP of US regions. Although as was shown in a previous report, the South has the largest GDP, it doesn't fare so well with per capita GDP, having the smallest of the four main regions.
Findings
- There is not much difference in per capita GDP between the regions.
- The ratio of richest US region to poorest US region is 1.29.
- The wealthiest region is less than a third better off than the poorest region.
Caveats
- The data is from 2016.
- The Northeast consists of (in descending order of GDP) New York, Pennsylvania, New Jersey, Massachusetts, Maryland, Connecticut, New Hampshire, Delaware, Maine, Rhode Island, and Vermont.
- The West consists of (in descending order of GDP) California, Washington, Colorado, Arizona, Oregon, Utah, Nevada, New Mexico, Hawaii, Idaho, Alaska, Montana, and Wyoming.
- The Midwest consists of (in descending order of GDP) Illinois, Ohio, Michigan, Indiana, Minnesota, Wisconsin, Missouri, Iowa, Kansas, Nebraska, North Dakota, and South Dakota.
- The South consists of (in descending order of GDP) Texas, Florida, Georgia, North Carolina, Virginia, Tennessee, Louisiana, South Carolina, Alabama, Kentucky, Oklahoma, Arkansas, Mississippi, and West Virginia.
Details
Even though the South has the largest economy, the size of its area and the number of people living in it guarantees that the per capita GDP of the region will be low compared to the other regions.
The West stays steady holding on to the second spot in both GDP and GDP per capita, while the Midwest improves slightly in the per capita metric and the Northeast improves significantly.
Sources
US Bureau of Economic Analysis. 2017. "Regional Data." Accessed October 26, 2017. https://bea.gov/itable/iTable.cfm?ReqID=70&step=1#reqid=70&step=1&isuri=1.
United States Census Bureau. "Annual Estimates of the Resident Population: April 1, 2010 to July 1, 2016." Accessed December 12, 2017. http://factfinder2.census.gov.