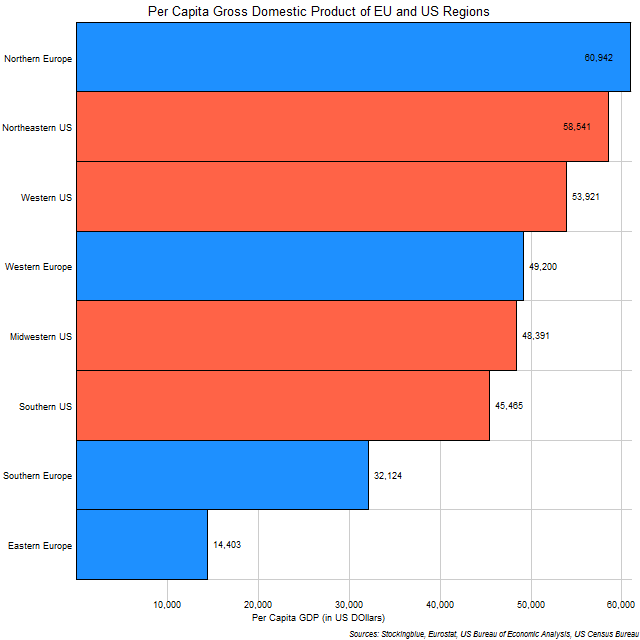
The chart above shows the per capita PPP GDP of EU and US regions. Although Europe has the wealthiest region as measured by the per capita metric, it also has the poorest regions by far.
Findings
- The European Union has the best performing region in the per capita GDP metric.
- It also has the worst performing regions.
- The ratio of richest region to poorest region in both the EU and the US is 4.23.
- The wealthiest region is more than four times better off than the poorest region.
Caveats
- The GDP data is from 2016 for both the EU and the US.
- The population data is from 2010 for both the EU and the US.
- Data for the EU and the US come from two different sources.
- EU data was converted from euros to dollars at the average 2016 0.77 euros to dollars rate.
- Northern Europe consists of (in descending order of GDP) Sweden, Denmark, and Finland.
- The Northeastern US consists of (in descending order of GDP) New York, Pennsylvania, New Jersey, Massachusetts, Maryland, Connecticut, New Hampshire, Delaware, Maine, Rhode Island, and Vermont.
- The Western US consists of (in descending order of GDP) California, Washington, Colorado, Arizona, Oregon, Utah, Nevada, New Mexico, Hawaii, Idaho, Alaska, Montana, and Wyoming.
- Western Europe consists of (in descending order of GDP) Germany, United Kingdom, France, Netherlands, Belgium, Austria, Ireland, and Luxembourg.
- The Midwestern US consists of (in descending order of GDP) Illinois, Ohio, Michigan, Indiana, Minnesota, Wisconsin, Missouri, Iowa, Kansas, Nebraska, North Dakota, and South Dakota.
- The Southern US consists of (in descending order of GDP) Texas, Florida, Georgia, North Carolina, Virginia, Tennessee, Louisiana, South Carolina, Alabama, Kentucky, Oklahoma, Arkansas, Mississippi, and West Virginia.
- Southern Europe consists of (in descending order of GDP) Italy, Spain, Portugal, Greece, Cyprus, and Malta.
- Eastern Europe consists of (in descending order of GDP) Poland, Czech Republic, Romania, Hungary, Slovakia, Bulgaria, Croatia, Slovenia, Lithuania, Latvia, and Estonia.
Details
This chart shows that the United States, through its relatively long history as a cohesive unit, has managed to maintain a certain standard of living throughout the nation. Whereas the European Union is still in its early days and has a long way to go in maintaining a certain standard of living throughout the Union. One can see the migratory pressures from Southern and Eastern Europe to Northern and Western Europe. Even though the US population is more mobile than the EU population is, the migratory pressures tend to be equal throughout the various regions.
In order for the EU to move forward and to remain a stable superstate this discrepancy in per capita PPP GDP needs to be dealt with one way or another. Having entire regions that have over four times the personal wealth (4.23 to be exact) as others is not a recipe for success especially when compared to the multiple in the US between wealthiest and poorest regions which is a mere 1.29.
Sources
Eurostat. 2017. "Data Explorer." Accessed December 11, 2017. http://appsso.eurostat.ec.europa.eu/nui/show.do?dataset=urb_lpop1&lang=en.
Eurostat. 2017. "Gross Domestic Product at Market Prices. Accessed October 26, 2017. http://ec.europa.eu/eurostat/tgm/refreshTableAction.do?tab=table&plugin=1&pcode=tec00001&language=en.
US Bureau of Economic Analysis. 2017. "Regional Data." Accessed October 26, 2017. https://bea.gov/itable/iTable.cfm?ReqID=70&step=1#reqid=70&step=1&isuri=1.
United States Census Bureau. "Annual Estimates of the Resident Population: April 1, 2010 to July 1, 2016." Accessed December 12, 2017. http://factfinder2.census.gov.