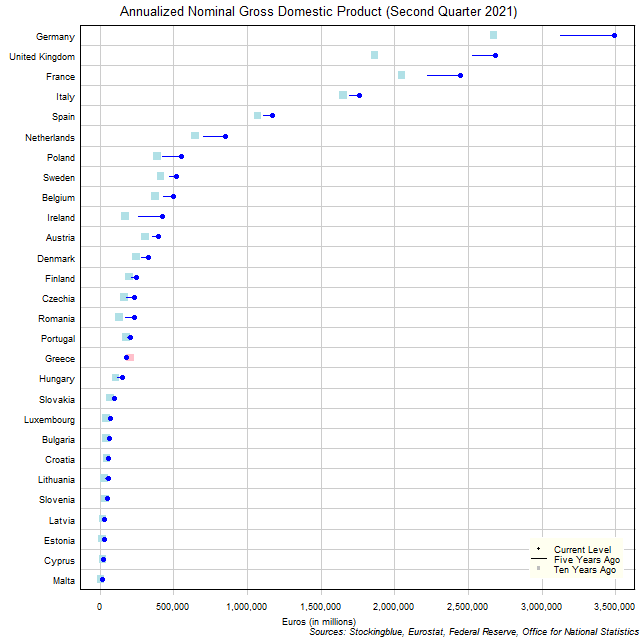
The chart above shows the annualized nominal gross domestic product (GDP) in each EU state as of the second quarter of 2021 in millions of euros, the change from five years ago, and the GDP ten years prior. Germany's economy grew more over the past five years than 17 states' entire GDP.
Findings
- The difference between the state with the largest GDP, Germany, and the state with the smallest, Malta, is €3,476,456.00 million (up from €3,110,789.60 million five years ago and up from €2,666,082.00 million ten years ago). Germany and Malta had the largest and smallest GDP respectively both five and ten years ago.
- Germany has 248.19 times the GDP that Malta does. The ratio of largest GDP to smallest GDP was down from 300.97 five years ago and down from 391.12 ten years ago.
- The median GDP in the 28 EU states is €236,142.60 million (up from €180,480.20 million five years ago and up from €175,207.40 ten years ago) and the mean €602,255.16 million (up from €536,429.17 five years ago and up from €471,049.00 ten years ago).
- Of the 28 states, 28 states had the GDP rise over the past five years while 0 had the GDP decline.
- Of the 28 states, 27 states had the GDP rise over the past ten years while 1 had the GDP decline.
Caveats
- Data is from the second quarters of 2021, 2016, and 2011.
- The data is seasonally adjusted in current euros.
- The data is annualized by multiplying the quarterly figure by four.
- All figures are rounded to the nearest hundredth.
Details
In absolute terms, Malta had the worst performance over the past five years with a gain of €3,693.60 million. Germany had the best performance with a gain of €369,360.00 million. Over the past ten years, Greece had the worst performance with a drop of €27,410.00 million while Germany had the best performance with a gain of €817,604.00 million.
In relative terms, Greece had the worst performance over the past five years with a 2.86% gain in GDP while Ireland had the best performance with a 62.51% rise in GDP. Over the past ten years, Greece had the worst performance with a 13.26% drop in GDP while Ireland had the best performance with a 142.70% rise in GDP.
There were 6 states with a GDP of over €500,000 million ten years ago, 6 states five years ago, and 8 states now. On the flip side, there were 9 states with a GDP of less than €50,000 million ten years ago, 8 states five years ago, and 4 states now.
Poland (from 9th to 7th), Ireland (from 12th to 10th), and Romania (from 17th to 15th) rose 2 spots in the five year period. Conversely, Portugal (from 14th to 16th) fell 2 spots in the five year period. Over the past ten years, Ireland (from 15th to 10th) rose 5 spots, while Greece (from 12th to 17th) fell 5 spots.
Data
| State | Second Quarter 2011 | Second Quarter 2016 | Second Quarter 2021 |
|---|---|---|---|
| Austria | 309,088.4 | 356,422.4 | 398824 |
| Belgium | 374744 | 430568 | 496840 |
| Bulgaria | 42,164.4 | 47,760.4 | 64,610.8 |
| Croatia | 45,810.4 | 47,070.8 | 55538 |
| Cyprus | 19,985.2 | 18692 | 22,776.8 |
| Czechia | 166,388.4 | 176,094.4 | 236,307.2 |
| Denmark | 248,138.4 | 282134 | 330,683.6 |
| Estonia | 16,528.8 | 21,434.4 | 29,715.6 |
| Finland | 197408 | 215976 | 248392 |
| France | 2050088 | 2224476 | 2443800 |
| Germany | 2672916 | 3121160 | 3490520 |
| Greece | 206,685.2 | 174,285.6 | 179,275.2 |
| Hungary | 106,147.6 | 115,682.8 | 151,191.6 |
| Ireland | 173,461.2 | 259064 | 420,993.2 |
| Italy | 1,651,854.8 | 1,690,810.4 | 1,758,434.8 |
| Latvia | 19,353.2 | 25,073.6 | 32,346.8 |
| Lithuania | 31,193.6 | 38,596.4 | 53528 |
| Luxembourg | 44,264.8 | 55,477.2 | 72,059.6 |
| Malta | 6834 | 10,370.4 | 14064 |
| Netherlands | 648,540.8 | 703730 | 847,369.2 |
| Poland | 390,569.2 | 424,246.8 | 553,162.8 |
| Portugal | 176,953.6 | 184866 | 208,432.4 |
| Romania | 133,109.6 | 169294 | 235978 |
| Slovakia | 71,278.8 | 80,785.2 | 96,985.2 |
| Slovenia | 37,042.8 | 39,971.2 | 50,857.2 |
| Spain | 1071136 | 1107040 | 1168236 |
| Sweden | 411,864.4 | 471,290.4 | 520,619.2 |
| United Kingdom | 1,865,822.4 | 2,527,644.4 | 2,681,603.2 |
Sources
Eurostat. 2021. "GDP and Main Components." Accessed December 1, 2021. https://appsso.eurostat.ec.europa.eu/nui/show.do?query=BOOKMARK_DS-406779_QID_-29650BF8_UID_-3F171EB0&layout=TIME,C,X,0;GEO,L,Y,0;UNIT,L,Z,0;S_ADJ,L,Z,1;NA_ITEM,L,Z,2;INDICATORS,C,Z,3;&zSelection=DS-406779UNIT,CP_MEUR;DS-406779INDICATORS,OBS_FLAG;DS-406779NA_ITEM,B1GQ;DS-406779S_ADJ,SCA;&rankName1=UNIT_1_2_-1_2&rankName2=INDICATORS_1_2_-1_2&rankName3=NA-ITEM_1_2_-1_2&rankName4=S-ADJ_1_2_-1_2&rankName5=TIME_1_0_0_0&rankName6=GEO_1_2_0_1&sortC=ASC_-1_FIRST&rStp=&cStp=&rDCh=&cDCh=&rDM=true&cDM=true&footnes=false&empty=false&wai=false&time_mode=NONE&time_most_recent=false&lang=EN&cfo=%23%23%23%2C%23%23%23.%23%23%23.
Federal Reserve. 2021. "Foreign Exchange Rates." Accessed December 1, 2021. https://www.federalreserve.gov/releases/g5/.
Office for National Statistics. 2021. "Gross Domestic Product at market prices: Current price: Seasonally adjusted £m - Office for National Statistics." Accessed December 1, 2021. https://www.ons.gov.uk/economy/grossdomesticproductgdp/timeseries/ybha/ukea.