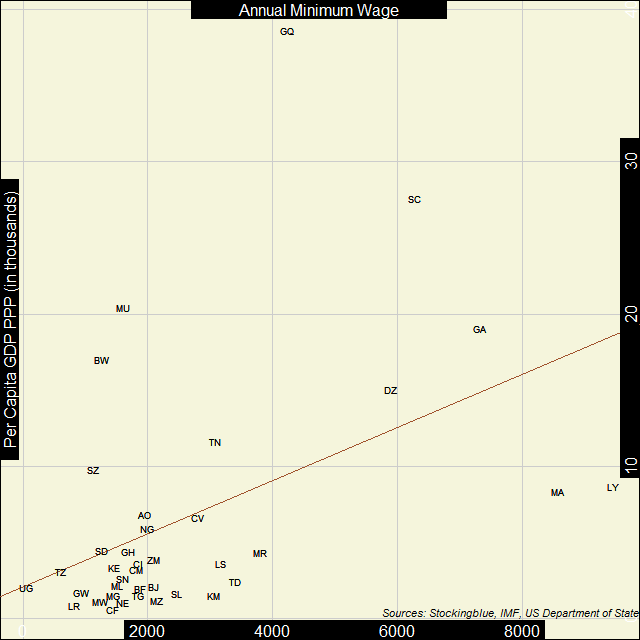
In Africa, the correlation between economic strength and the minimum wage is pretty weak. The majority of nations on the continent have a per capita GDP PPP below 10,000 international dollars and a minimum wage below 4,000 international dollars.
Findings
- The correlation coefficient between per capita Gross Domestic Product (GDP) in Purchasing Power Parity (PPP) and minimum wage in Africa is 0.46.
- As economic strength increases in Africa, the minimum wage also increases.
- Uganda has the lowest minimum wages on the continent but manages to have the 12th smallest per capita GDP PPP.
- The Central African Republic has the smallest per capita GDP PPP but has the ninth lowest minimum wages.
- Equatorial Guinea has the largest per capita GDP PPP but the sixth highest minimum wage on the continent.
- Libya on the other hand, has the highest minimum wage but only the ninth largest per capita GDP PPP.
Caveats
- As always, correlation does not imply causation.
- Burundi, Congo, the Democratic Republic of the Congo, Djibouti, Egypt, Eritrea, Ethiopia, Gambia, Guinea, Mayotte, Namibia, Réunion, Rwanda, Sao Tome and Principe, Somalia, South Africa, South Sudan, Western Sahara, and Zimbabwe were missing data.
- Minimum wages sometimes vary by profession and other variables.
Details
The vast majority of countries on the continent have an annual minimum wage below 4,000 international dollars and a per capita GDP PPP below 10,000 international dollars. All countries that have a minimum wage below 4,000 international dollars and a per capita GDP PPP below 10,000 international dollars are from sub-Saharan Africa.
Only nine countries - Libya, Morocco, Gabon, Seychelles, Algeria, Equatorial Guinea, Tunisia, Mauritius, and Botswana - have a minimum wage above 4,000 international dollars, a per capita GDP PPP above 10,000 international dollars, or both.
Per capita GDP PPP as a multiple of minimum wage, ranges from 0.45 in the Central African Republic where the minimum wage is higher than the per capita GDP PPP to 33.90 in Uganda.
Country Codes
| Code | Country |
|---|---|
| AO | Angola |
| BF | Burkina Faso |
| BJ | Benin |
| BW | Botswana |
| CF | Central African Republic |
| CI | Ivory Coast |
| CM | Cameroon |
| CV | Cape Verde |
| DZ | Algeria |
| GA | Gabon |
| GH | Ghana |
| GQ | Equatorial Guinea |
| GW | Guinea-Bissau |
| KE | Kenya |
| KM | Comoros |
| LR | Liberia |
| LS | Lesotho |
| LY | Libya |
| MA | Morocco |
| MG | Madagascar |
| ML | Mali |
| MR | Mauritania |
| MU | Mauritius |
| MW | Malawi |
| MZ | Mozambique |
| NE | Niger |
| NG | Nigeria |
| SC | Seychelles |
| SD | Sudan |
| SL | Sierra Leone |
| SN | Senegal |
| SZ | Swaziland |
| TD | Chad |
| TG | Togo |
| TN | Tunisia |
| TZ | Tanzania |
| UG | Uganda |
| ZM | Zambia |
Sources
US Department of State. 2017. "Country Reports on Human Rights Practices for 2016." Accessed September 2, 2017. https://www.state.gov/j/drl/rls/hrrpt/humanrightsreport/index.htm#wrapper.