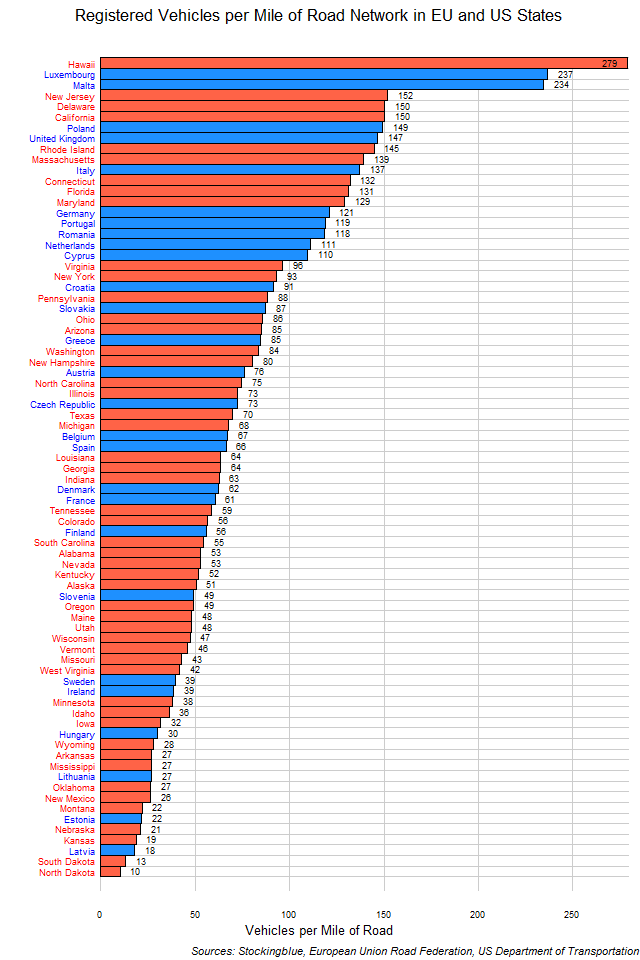
The chart above shows the number of motor vehicles in EU and US states by mile of roads. Some of the smallest states have the highest ratio of vehicles to roads but in the EU, small states also have some of the lowest ratios of vehicles to roads.
Findings
- The difference between the state with the most vehicles per mile, Hawaii, and the state with the least, North Dakota, is 269 vehicles per mile of road (167 vehicles per kilometer of road).
- Hawaii has 27 times the number of vehicles per unit of road that North Dakota does.
- Only three states have at least 200 vehicles per mile of road (124 vehicles per kilometer of road).
- The mean rate of vehicles per mile for the EU is 90.04 (55.95 per km) and the median 75.96 (47.20 per km).
- The mean rate of vehicles per mile for the US is 70.44 (43.77 per km) and the median 55.50 (34.49 per km).
- The mean rate of vehicles per mile for the US and the EU combined is 77.31 (48.04 per km) and the median 63.51 (39.46 per km).
Caveats
- EU and US ownership data is from 2015.
- EU road length data is from 2008 except for Denmark which is from 2006, and Italy and Portugal which are from 2005. US road length data is from 2015.
- EU and US data come from different sources.
- Ownership and road length data come from different sources.
- Bulgaria is not included because it did not have complete data in the road data set.
- Total vehicles include automobiles, taxis, buses, trucks, and motorcycles of both public and private use.
Details
The EU has a tighter range with its lowest ratio of vehicles to roads being 17.78 vehicles per mile (11.05 per km) in Latvia and its highest ratio being 236.52 vehicles per mile (146.97 per km) in Luxembourg. The EU state with the largest ratio only has 13 times the ratio of the state with the smallest, whereas the largest US state has a ratio 27 times that of the smallest.
It's hard to tell from this data whether these states have either too many or too few roads or too many or too few vehicles but one thing is for sure, parking is a much easier affair in the Dakotas and the Baltics.
Sources
European Union Road Federation. 2011. "European Road Statistics 2011." Accessed March 12, 2018. http://www.irfnet.eu/images/stories/Statistics/2011/ERF-2011-STATS.pdf.
International Organization of Motor Vehicle Manufacturers. 2018. "Vehicles in Use - OICA." Accessed January 20, 2018. http://www.oica.net/category/vehicles-in-use/.
United States Department of Transportation. 2016. "Table HM-10M - Highway Statistics 2015 - Policy | Federal Highway Administration." Accessed March 12, 2018. https://www.fhwa.dot.gov/policyinformation/statistics/2015/hm10m.cfm.
United States Department of Transportation. 2018. "Table MV-1 - Highway Statistics 2015." Accessed February 20, 2018. https://www.fhwa.dot.gov/policyinformation/statistics/2015/mv1.cfm.