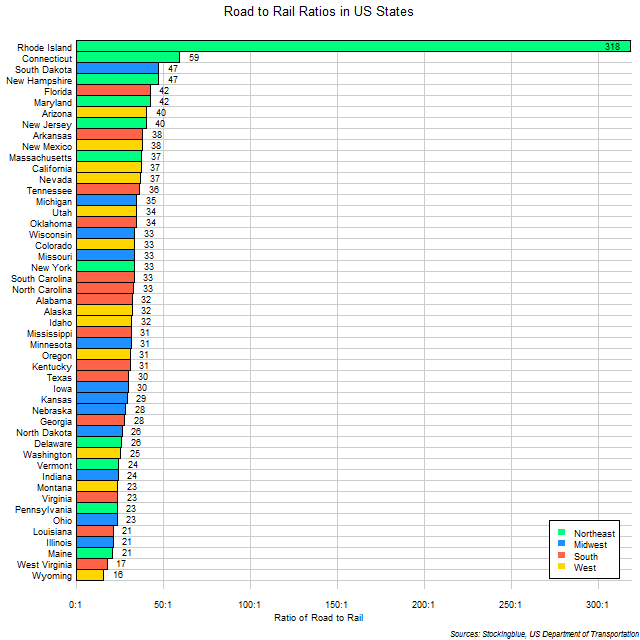
The chart above shows the ratio of the road network to the rail network in every US state. The larger the ratio, the more prevalent roads are over rail in the state. For instance, Rhode Island has 318 more miles of road for every mile of rail. Rhode Island is the only state with such a high ratio as every other state has a ratio of 60:1 or less.
Findings
- The difference between the state with the largest ratio, Rhode Island, and the state with the smallest ratio, Wyoming, is 303.
- Rhode Island has 20 times the road to rail ratio that Wyoming has.
- Only Rhode Island has a ratio that is greater than 100 miles of road for every mile of rail.
- The mean ratio of the 50 states is 37.51:1 and the median 31.88:1.
Caveats
- Road and rail length data is from 2015.
- Rail and road length data come from different sources.
- Hawaii is not included because it does not have a rail network and thus its road to rail ratio is infinite.
- The vast majority of the US rail network is used for freight purposes exclusively.
Details
It surprising to see that in the vast majority of states there are no more than 50 miles of road for every mile of rail considering how extensive the US roadway network is. It is often forgotten that the US has the largest rail network in the world as it is used almost exclusively for freight purposes and only a very small percentage of it is used for passengers.
The ratio for the entire United States is 29.95 miles of road for every mile of rail which ranks the US as a whole just under Texas and just above Iowa (the figures in the chart are rounded to the nearest whole number).
Sources
United States Department of Transportation. 2015. "State Transportation by the Numbers." Accessed March 21, 2018. https://www.bts.gov/sites/bts.dot.gov/files/legacy/_entire.pdf.
United States Department of Transportation. 2016. "Table HM-10M - Highway Statistics 2015 - Policy | Federal Highway Administration." Accessed March 12, 2018. https://www.fhwa.dot.gov/policyinformation/statistics/2015/hm10m.cfm.