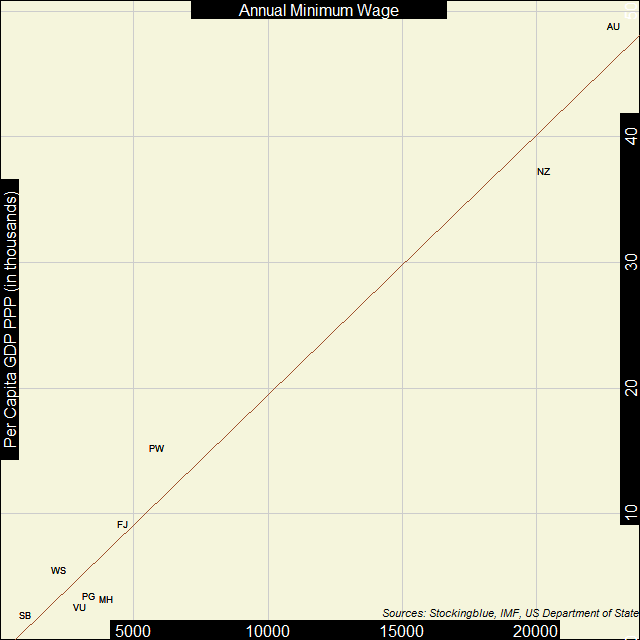
In Oceania, the correlation between economic strength and the minimum wage is extremely strong. As far as these metrics go, there's New Zealand and Australia, and then there's everyone else.
Findings
- The correlation coefficient between per capita Gross Domestic Product (GDP) in Purchasing Power Parity (PPP) and minimum wage in Oceania is 0.99.
- As economic strength increases in Oceania, the minimum wage also increases.
- The Solomon Islands have the lowest minimum wages and the smallest per capita GDP PPP on the continent.
- Australia has both the highest minimum wages and the largest per capita GDP PPP on the continent.
Caveats
- As always, correlation does not imply causation.
- American Samoa, Cook Islands, French Polynesia, Guam, Kiribati, Micronesia, Nauru, New Caledonia, Niue, Norfolk Island, Northern Mariana Islands, Pitcairn, Tokelau, Tonga, Tuvalu, and Wallis and Futuna were missing data.
- Minimum wages sometimes vary by profession and other variables.
Details
With the exception of Australia and New Zealand, all countries have a per capita GDP PPP below 16,000 international dollars and an annual minimum wage below 6,000 international dollars.
Australia and New Zealand have a per capita GDP PPP that is at least double the third country's (Palau) and an annual minimum wage that is at least triple Palau's which also has the third highest annual minimum wage on the continent.
Per capita GDP PPP as a multiple of minimum wage, ranges from 0.83 in the Marshall Islands where the minimum wage is higher than the per capita GDP PPP to 2.60 in Palau.
Country Codes
| Code | Country |
|---|---|
| AU | Australia |
| FJ | Fiji |
| MH | Marshall Islands |
| NZ | New Zealand |
| PG | Papua New Guinea |
| PW | Palau |
| SB | Solomon Islands |
| VU | Vanuatu |
| WS | Samoa |
Sources
US Department of State. 2017. "Country Reports on Human Rights Practices for 2016." Accessed September 2, 2017. https://www.state.gov/j/drl/rls/hrrpt/humanrightsreport/index.htm#wrapper.