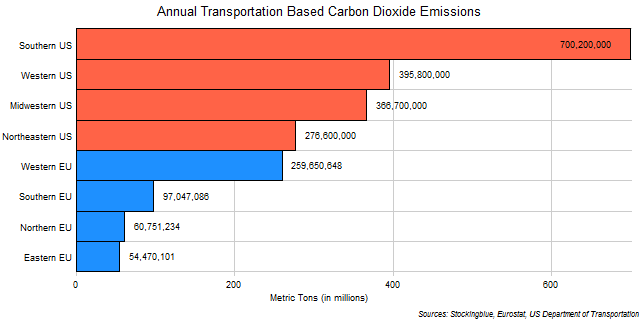
The chart above shows transportation based carbon dioxide emissions in EU and US regions. Clearly, US regions emit far more transportation-based carbon dioxide than EU regions do.
Findings
- The difference between the region with the most emissions, the Southern US, and the region with the least, the Eastern EU, is 646 million metric tons.
- The Southern US emits 12.85 times the carbon dioxide that the Eastern EU does.
- All the EU regions combined emit less transportation-based carbon dioxide than the Southern US does.
- All US regions emit at least 275 million metric tons of carbon dioxide, whereas all EU regions emit less than 275 million metric tons.
Caveats
- Emissions data is from 2013.
- Malta's figures are estimates.
- Washington DC is excluded from the list but emits one million metric tons. It would be included in the Northeastern US.
- The Southern US consists of Texas, Florida, Georgia, North Carolina, Virginia, Tennessee, Louisiana, South Carolina, Alabama, Kentucky, Oklahoma, Arkansas, Mississippi, and West Virginia.
- The Western US consists of California, Washington, Colorado, Arizona, Oregon, Utah, Nevada, New Mexico, Hawaii, Idaho, Alaska, Montana, and Wyoming.
- The Midwestern US consists of Illinois, Ohio, Michigan, Indiana, Minnesota, Wisconsin, Missouri, Iowa, Kansas, Nebraska, North Dakota, and South Dakota.
- The Northeastern US consists of New York, Pennsylvania, New Jersey, Massachusetts, Maryland, Connecticut, New Hampshire, Delaware, Maine, Rhode Island, and Vermont.
- The Western EU consists of Germany, United Kingdom, France, Netherlands, Belgium, Austria, Ireland, and Luxembourg.
- The Southern EU consists of Italy, Spain, Portugal, Greece, Cyprus, and Malta.
- The Northern EU consists of Sweden, Denmark, and Finland.
- The Eastern EU consists of Poland, Czech Republic, Romania, Hungary, Slovakia, Bulgaria, Croatia, Slovenia, Lithuania, Latvia, and Estonia.
Details
The Southern and Western US account for nearly half of the transportation-based emissions in the EU and US. The US accounts for nearly four-fifths of the emissions between the EU and the US.
The European Union as a whole emits 471,919,069 metric tons of carbon dioxide from transportation sources annually (less than the Southern US does all by itself). The United States as a whole emits 1,739,300,000 metric tons of carbon dioxide from transportation sources annually.
Sources
Eurostat. 2018. "Eurostat - Data Explorer: Air Emissions Accounts." Accessed April 17, 2018. http://appsso.eurostat.ec.europa.eu/nui/show.do?query=BOOKMARK_DS-286146_QID_2207DEA6_UID_-3F171EB0&layout=TIME,C,X,0;GEO,L,Y,0;AIRPOL,L,Z,0;NACE_R2,L,Z,1;UNIT,L,Z,2;INDICATORS,C,Z,3;&zSelection=DS-286146INDICATORS,OBS_FLAG;DS-286146UNIT,T;DS-286146NACE_R2,H;DS-286146AIRPOL,CO2;&rankName1=UNIT_1_2_-1_2&rankName2=AIRPOL_1_2_-1_2&rankName3=INDICATORS_1_2_-1_2&rankName4=NACE-R2_1_2_-1_2&rankName5=TIME_1_0_0_0&rankName6=GEO_1_2_0_1&sortC=ASC_-1_FIRST&rStp=&cStp=&rDCh=&cDCh=&rDM=true&cDM=true&footnes=false&empty=false&wai=false&time_mode=NONE&time_most_recent=false&lang=EN&cfo=%23%23%23%2C%23%23%23.%23%23%23.
United States Department of Transportation. 2015. "State Transportation by the Numbers." Accessed March 21, 2018. https://www.bts.gov/sites/bts.dot.gov/files/legacy/_entire.pdf.