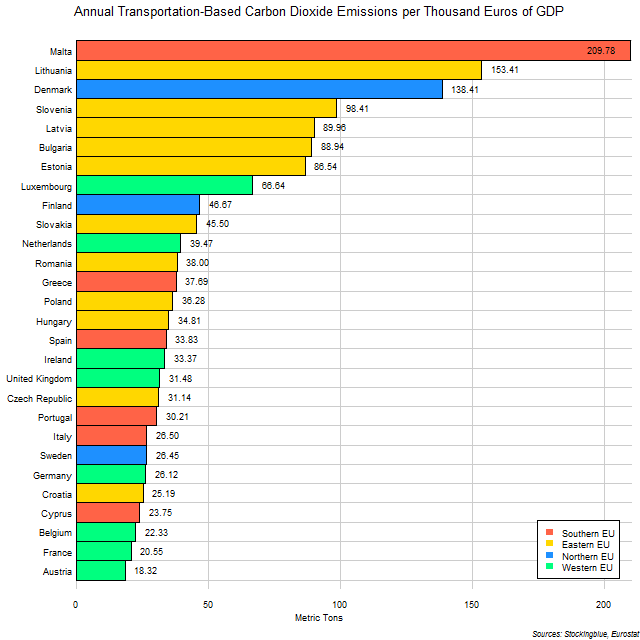
The chart above shows transportation-based carbon dioxide emissions broken down by economic output in EU states. Three out of the top five polluting states in this metric are from the Eastern EU.
Findings
- The difference between the state with the most emissions per thousand euros of GDP, Malta, and the state with the least, Austria, is 191.46 metric tons.
- Malta emits 11.45 times the carbon dioxide per thousand euros of GDP that Austria does.
- Only Malta emits more than 200 metric tons and only Austria emits less than 20.
- The mean transportation-based carbon dioxide emissions for every thousand in GDP for the 28 states is 55.70 and the median 35.54.
Caveats
- GDP data is from 2016.
- Emissions data is from 2013.
- All figures are rounded to the nearest hundredth.
Details
The Eastern EU fares much better when carbon dioxide emissions are measured on a per capita basis. A future post will plot these values against each other to see if any correlations exist.
The European Union as a whole emits 31.66 metric tons of carbon dioxide per thousand euros of GDP from transportation sources annually ranking it just under Ireland and above the United Kingdom.
Sources
Eurostat. 2017. "Data Explorer." Accessed December 11, 2017. http://appsso.eurostat.ec.europa.eu/nui/show.do?dataset=urb_lpop1&lang=en.
Eurostat. 2017. "Gross Domestic Product at Market Prices. Accessed October 26, 2017. http://ec.europa.eu/eurostat/tgm/refreshTableAction.do?tab=table&plugin=1&pcode=tec00001&language=en.