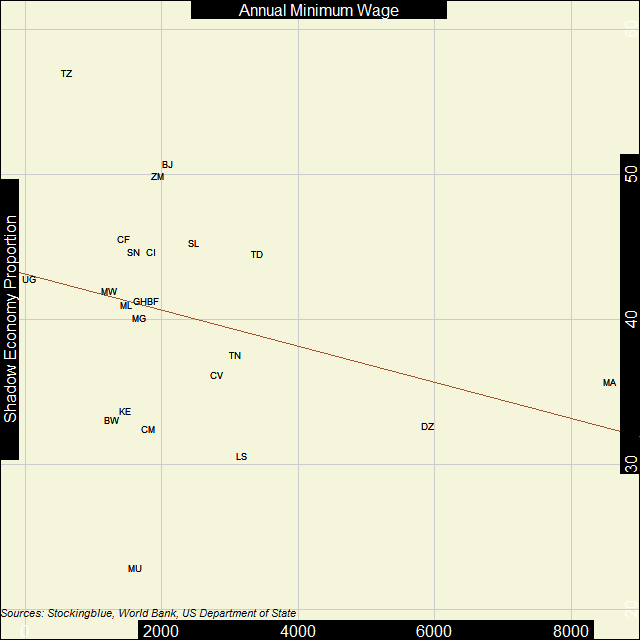
In Africa, the inverse correlation between the strength of the shadow economy and the minimum wage is very weak. There is no real relationship between the strength of the shadow economy and minimum wage.
Findings
- The correlation coefficient between per capita Gross Domestic Product (GDP) in Purchasing Power Parity (PPP) and minimum wage in Africa is -0.29.
- As the shadow economy increases in the continent, the minimum wage does not necessarily decrease.
- Mauritius has the weakest shadow economy and one of the lowest minimum wages.
- Morocco has the seventh weakest shadow economy and the highest minimum wage.
- Uganda has the lowest minimum wage and ninth strongest shadow economy.
- Tanzania has the second lowest minimum wage and the strongest shadow economy.
- Yemen has the lowest minimum wage and the 15th weakest shadow economy.
- Only Thailand and Georgia have shadow economy that takes up more than half of their overall economy.
Caveats
- As always, correlation does not imply causation.
- Angola, Burundi, Comoros, Congo, Democratic Republic of the Congo, Djibouti, Egypt, Equatorial Guinea, Eritrea, Ethiopia, Gabon, Gambia, Guinea, Guinea-Bissau, Liberia, Libya, Mauritania, Mayotte, Mozambique, Namibia, Niger, Nigeria, Rwanda, Sao Tome and Principe, Seychelles, Somalia, South Africa, South Sudan, Sudan, Swaziland, Togo, Western Sahara, and Zimbabwe were missing data.
- Minimum wages sometimes vary by profession and other variables.
Details
Unlike Europe and Asia, there are no geographic clusters with this dataset in Africa. What the data does show however, is that regardless of what the minimum wage is, the strength of the shadow economy can range from being very weak to very strong as there is an entire cluster of nations whose minimum wage is similar but the shadow economy can take up anywhere from one-fifth to three-fifths of the overall economy.
Like Asia, there is no correlation between the strength of a shadow economy and the minimum wage.
Country Codes
| Code | Country | Annual Minimum Wage | Shadow Economy (as Percentage of GDP) |
|---|---|---|---|
| BF | Burkina Faso | 1,877 | 41.3 |
| BJ | Benin | 2,102 | 50.7 |
| BW | Botswana | 1,279 | 33.1 |
| CF | Central African Republic | 1,455 | 45.6 |
| CI | Ivory Coast | 1,858 | 44.7 |
| CM | Cameroon | 1,812 | 32.5 |
| CV | Cape Verde | 2,812 | 36.2 |
| DZ | Algeria | 5,908 | 32.7 |
| GH | Ghana | 1,687 | 41.1 |
| KE | Kenya | 1,473 | 33.7 |
| LS | Lesotho | 3,185 | 30.6 |
| MA | Morocco | 8,580 | 35.7 |
| MG | Madagascar | 1,676 | 41.1 |
| ML | Mali | 1,513 | 41.0 |
| MU | Mauritius | 1,618 | 22.9 |
| MW | Malawi | 1,244 | 42.0 |
| SL | Sierra Leone | 2,480 | 45.3 |
| SN | Senegal | 1,610 | 44.7 |
| TD | Chad | 3,406 | 44.5 |
| TN | Tunisia | 3,085 | 37.6 |
| TZ | Tanzania | 616 | 57.0 |
| UG | Uganda | 61 | 42.8 |
| ZM | Zambia | 1,948 | 49.9 |
Sources
US Department of State. 2017. "Country Reports on Human Rights Practices for 2016." Accessed September 2, 2017. https://www.state.gov/j/drl/rls/hrrpt/humanrightsreport/index.htm#wrapper.
Schneider, Friedrich, Andreas Buehn, and Claudio E. Montenegro. 2010. "Shadow Economies All over the World: New Estimates for 162 Countries from 1999 to 2007." The World Bank Development Research Group.