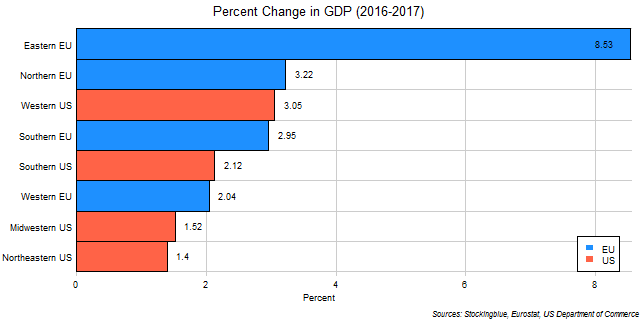
The chart above shows change in GDP over the last year in EU and US regions. The Eastern EU was the fastest growing region in both the EU and the US by far.
Findings
- The difference between the region with the greatest growth in GDP, the Eastern EU, and the region with the least, the Northeastern US, is 7.14 percentage points.
- The Eastern EU has 6.12 times the economic growth that the Northeastern US does in the past year.
Caveats
- All figures are rounded to the nearest hundredth.
- EU and US data come from different sources.
- The Eastern EU consists of Poland, Czech Republic, Romania, Hungary, Slovakia, Bulgaria, Croatia, Slovenia, Lithuania, Latvia, and Estonia.
- The Northern EU consists of Sweden, Denmark, and Finland.
- The Western US consists of California, Washington, Colorado, Arizona, Oregon, Utah, Nevada, New Mexico, Hawaii, Idaho, Alaska, Montana, and Wyoming.
- The Southern EU consists of Italy, Spain, Portugal, Greece, Cyprus, and Malta.
- The Southern US consists of Texas, Florida, Georgia, North Carolina, Virginia, Tennessee, Louisiana, South Carolina, Alabama, Kentucky, Oklahoma, Arkansas, Mississippi, and West Virginia.
- The Western EU consists of Germany, United Kingdom, France, Netherlands, Belgium, Austria, Ireland, and Luxembourg.
- The Midwestern US consists of Illinois, Ohio, Michigan, Indiana, Minnesota, Wisconsin, Missouri, Iowa, Kansas, Nebraska, North Dakota, and South Dakota.
- The Northeastern US consists of New York, Pennsylvania, New Jersey, Massachusetts, Maryland, Connecticut, New Hampshire, Delaware, Maine, Rhode Island, and Vermont.
Details
The EU regions, as a whole have done better than the US not only last year, but over the past ten years as well, excluding the Southern EU which has had an abysmal decade. However, US states tend to be have more homogeneous growth rates than the EU does which is understandable as the EU is a relatively new superstate.
The European Union as a whole has 2.83 percent growth over the same one year period ranking it just under the Southern EU and above the Southern US. The United States as a whole has 2.07 percent growth over the same one year period ranking it under the Southern US and above the Western EU.
Sources
Eurostat. 2018. "Eurostat - Tables, Graphs and Maps Interface." Accessed June 26, 2018. http://ec.europa.eu/eurostat/tgm/table.do?tab=table&init=1&language=en&pcode=tec00001&plugin=1.
US Department of Commerce. 2018. "US Bureau of Economic Analysis." Accessed June 26, 2018. https://bea.gov/itable/iTable.cfm?ReqID=70&step=1#reqid=70&step=10&isuri=1&7003=1000&7035=-1&7004=naics&7005=1&7006=01000,02000,04000,05000,06000,08000,09000,10000,11000,12000,13000,15000,16000,17000,18000,19000,20000,21000,22000,23000,24000,25000,26000,27000,28000,29000,30000,31000,32000,33000,34000,35000,36000,37000,38000,39000,40000,41000,42000,44000,45000,46000,47000,48000,49000,50000,51000,53000,54000,55000,56000&7036=-1&7001=11000&7002=1&7090=70&7007=2017,2016,2015,2014,2013,2012,2011,2010,2009,2008,2007,2006&7093=levels.