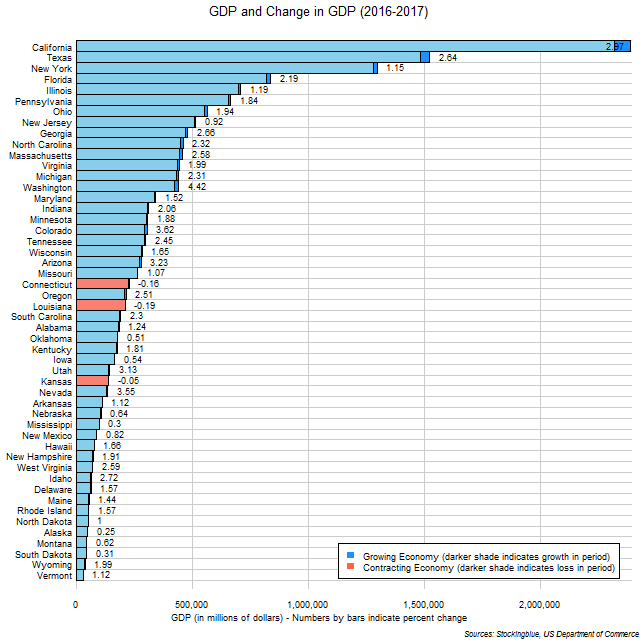
The chart above shows the GDP and change in GDP over the last year in US states in dollars. Although Washington had the sixth greatest relative growth at 2.97%, it had the largest absolute growth of all the states.
Findings
- The difference between the state with the greatest absolute growth in GDP, California, and the state with the least, Alaska, is $68,804,000,000.
- California has 584.08 times the absolute economic growth that Alaska does in the past year.
- The difference between the state with the greatest relative growth in GDP, Washington, and the state with the least, Alaska, is 4.17 percentage points.
- Washington has 17.58 times the relative economic growth rate that Alaska does in the past year.
- Kansas, Connecticut, and Louisiana were the only states in the Union whose economy contracted in the past year.
- Oregon overtook Louisiana to become the 24th largest economy in the US.
- Utah overtook Kansas to become the 31st largest economy in the US.
- Montana overtook South Dakota to become the 47th largest economy in the US.
Caveats
- All percentages are rounded to the nearest hundredth.
Details
Only three states surpassed other states in the size of their economy in the past year. Oregon went from a GDP of $207,367 million to a GDP of $212,573 million while Louisiana shrank from a GDP of $208,252 million to a GDP of $207,854 million. Utah went from a GDP of $136,833 million to a GDP of $141,111 million while Kansas shrank from a GDP of $138,258 million to a GDP of $138,185 million. Montana went from a GDP of $41,589 million to a GDP of $41,845 million while South Dakota grew from a GDP of $41,618 million to a GDP of $41,748 million.
The United States as a whole grew by $336,466 million last year for a growth rate of 2.07%.
Sources
US Department of Commerce. 2018. "US Bureau of Economic Analysis." Accessed June 26, 2018. https://bea.gov/itable/iTable.cfm?ReqID=70&step=1#reqid=70&step=10&isuri=1&7003=1000&7035=-1&7004=naics&7005=1&7006=01000,02000,04000,05000,06000,08000,09000,10000,11000,12000,13000,15000,16000,17000,18000,19000,20000,21000,22000,23000,24000,25000,26000,27000,28000,29000,30000,31000,32000,33000,34000,35000,36000,37000,38000,39000,40000,41000,42000,44000,45000,46000,47000,48000,49000,50000,51000,53000,54000,55000,56000&7036=-1&7001=11000&7002=1&7090=70&7007=2017,2016,2015,2014,2013,2012,2011,2010,2009,2008,2007,2006&7093=levels.