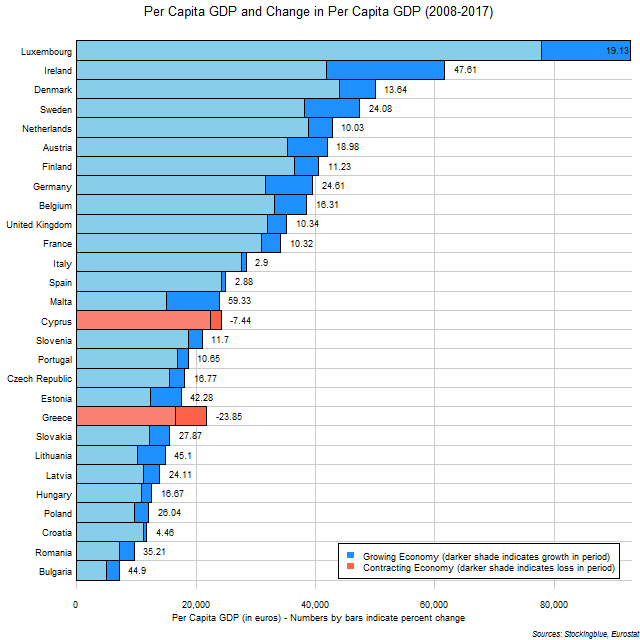
The chart above shows the per capita GDP and change in per capita GDP over the last ten years in EU states. Malta had the largest growth rate but Luxembourg had the greatest absolute growth in the ten-year period. Greece and Cyprus were the only two states whose per capita GDP contracted in the period.
Findings
- The difference between the state with the greatest absolute growth in per capita GDP, Luxembourg, and the state with the least, Croatia, is €19,400.
- Luxembourg has 39.80 times the per capita absolute economic growth that Croatia does in the past ten years.
- The difference between the state with the greatest growth rate in per capita GDP, Malta, and the state with the least, Spain, is 56.45 percentage points.
- Malta has 20.60 times the per capita economic growth rate that Spain does in the past ten years.
- Greece and Cyprus are the only two economies whose per capita GDP shrank in the past ten years.
- Ireland overtook Denmark to become the state with the second highest per capita GDP in the EU.
- Sweden overtook the Netherlands to become the state with the fourth highest per capita GDP in the EU.
- Austria overtook Finland to become the state with the sixth highest per capita GDP in the EU.
- Germany overtook the United Kingdom and Belgium to become the state with the eighth highest per capita GDP in the EU.
- Malta overtook the Czech Republic, Portugal, Slovenia, Greece, and Cyprus to become the state with the 14th highest per capita GDP in the EU.
- Slovenia, Portugal, the Czech Republic and Estonia all overtook Greece.
- Lithuania overtook Hungary, Croatia, and Latvia.
- Hungary and Poland both overtook Croatia.
Caveats
- All percentages are rounded to the nearest hundredth.
Details
Malta has had both the greatest growth rate in per capita GDP and total GDP over the past ten years.
The median per capita GDP for the 28 states went from €23,000 in 2008 to €23,150 in 2017 while the mean went from €24,782 to €29,061.
Sources
Eurostat. 2018. "Eurostat - Tables, Graphs and Maps Interface." Accessed August 2, 2018. http://appsso.eurostat.ec.europa.eu/nui/show.do?query=BOOKMARK_DS-420898_QID_-378D3319_UID_-3F171EB0&layout=TIME,C,X,0;GEO,L,Y,0;UNIT,L,Z,0;NA_ITEM,L,Z,1;INDICATORS,C,Z,2;&zSelection=DS-420898INDICATORS,OBS_FLAG;DS-420898UNIT,CP_EUR_HAB;DS-420898NA_ITEM,B1GQ;&rankName1=UNIT_1_2_-1_2&rankName2=INDICATORS_1_2_-1_2&rankName3=NA-ITEM_1_2_-1_2&rankName4=TIME_1_0_0_0&rankName5=GEO_1_2_0_1&sortC=ASC_-1_FIRST&rStp=&cStp=&rDCh=&cDCh=&rDM=true&cDM=true&footnes=false&empty=false&wai=false&time_mode=NONE&time_most_recent=false&lang=EN&cfo=%23%23%23%2C%23%23%23.%23%23%23.