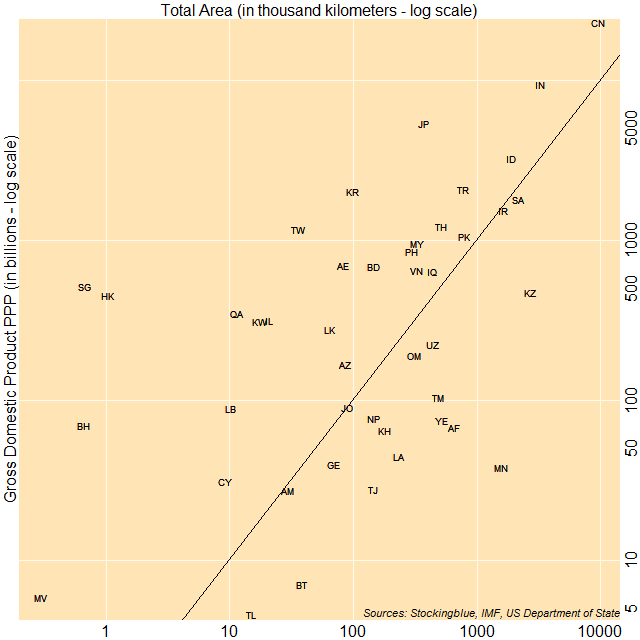
The chart above shows economic output as it relates to land area. The countries to the top left of the diagonal line have a gross domestic product (GDP) of over one million international dollars per square kilometer, while countries to the bottom right have a GDP that is less than one million dollars per square kilometer. Singapore, Hong Kong, and Bahrain have the largest ratio of GDP to area whereas Mongolia, Afghanistan, and Yemen have the smallest ratio of GDP to area.
Findings
- Asia has three countries that make over 100 million international dollars per square kilometer.
- Mongolia has the smallest ratio of GDP to area with an economy of just over 24,000 times that of its area in square kilometers.
- Singapore has the largest ratio of GDP to area with an economy of just over 753 million times that of its area in square kilometers.
- Only Mongolia has a GDP that is less than 100,000 international dollars per square kilometer.
Caveats
- A country with a large landmass and a small population is likely to have a smaller ratio, whereas a small country with a large population density can have a larger ratio. Thus the data may not reflect how productive a country is.
- British Indian Ocean Territory, Brunei Darussalam, Christmas Island, Cocos (Keeling) Islands, North Korea, Kyrgyzstan, Macao, Myanmar, Palestine, and Syria were missing data.
Details
Once again, just like in Europe, former Soviet republics do not fare so well. Only Azerbaijan manages to make over one million international dollars per square kilometers.
As far as the countries of the Arabian peninsula, only Oman, Saudi Arabia, and Yemen make less than one million international dollars per square kilometer. Even war torn Iraq manages to pull off a GDP of over one million international dollars per square kilometer.
South Asia is split with two countries (Nepal and Bhutan) making less than one million international dollars per square kilometer while the other five (Pakistan, India, Maldives, Sri Lanka, and Bangladesh) make more than one million international dollars per square kilometer likely due to their high population densities.
Mongolia is the only East Asian state to make less than one million dollars per square kilometer.
Data
| Code | Country | Area (square km) | GDP (in millions) | GDP Per Square Kilometer |
|---|---|---|---|---|
| MN | Mongolia | 1,564,116 | 37,731 | 24,122.89 |
| AF | Afghanistan | 652,230 | 67,462 | 103,432.84 |
| YE | Yemen | 527,968 | 74,250 | 140,633.52 |
| KZ | Kazakhstan | 2,724,900 | 472,563 | 173,423.98 |
| BT | Bhutan | 38,394 | 7,045 | 183,492.21 |
| LA | Laos | 236,800 | 44,639 | 188,509.29 |
| TJ | Tajikistan | 144,100 | 27,802 | 192,935.46 |
| TM | Turkmenistan | 488,100 | 103,987 | 213,044.46 |
| TL | Timor-Leste | 14,874 | 4,567 | 307,045.85 |
| KH | Cambodia | 181,035 | 64,405 | 355,759.94 |
| UZ | Uzbekistan | 447,400 | 222,792 | 497,970.50 |
| NP | Nepal | 147,181 | 77,147 | 524,164.12 |
| GE | Georgia | 69,700 | 39,318 | 564,103.30 |
| OM | Oman | 309,500 | 189,582 | 612,542.81 |
| SA | Saudi Arabia | 2,149,690 | 1,796,205 | 835,564.66 |
| AM | Armenia | 29,743 | 27,116 | 911,676.70 |
| IR | Iran | 1,648,195 | 1,535,491 | 931,619.74 |
| JO | Jordan | 89,342 | 89,555 | 1,002,384.10 |
| PK | Pakistan | 796,095 | 1,060,569 | 1,332,214.12 |
| IQ | Iraq | 438,317 | 641,005 | 1,462,423.31 |
| ID | Indonesia | 1,904,569 | 3,257,123 | 1,710,162.77 |
| AZ | Azerbaijan | 86,600 | 167,431 | 1,933,383.37 |
| VN | Vietnam | 331,210 | 648,243 | 1,957,196.34 |
| TH | Thailand | 513,120 | 1,226,407 | 2,390,097.83 |
| CN | China | 9,596,960 | 23,194,411 | 2,416,849.81 |
| TR | Turkey | 783,562 | 2,082,079 | 2,657,197.52 |
| MY | Malaysia | 329,847 | 922,057 | 2,795,408.17 |
| IN | India | 3,287,263 | 9,489,302 | 2,886,687.80 |
| PH | Philippines | 300,000 | 878,980 | 2,929,933.33 |
| CY | Cyprus | 9,251 | 31,093 | 3,361,042.05 |
| LK | Sri Lanka | 65,610 | 278,415 | 4,243,484.22 |
| BD | Bangladesh | 148,460 | 686,598 | 4,624,801.29 |
| AE | United Arab Emirates | 83,600 | 693,765 | 8,298,624.40 |
| LB | Lebanon | 10,400 | 88,786 | 8,537,115.38 |
| JP | Japan | 377,915 | 5,420,228 | 14,342,452.67 |
| IL | Israel | 20,770 | 316,120 | 15,220,028.89 |
| KW | Kuwait | 17,818 | 309,640 | 17,377,932.43 |
| MV | Maldives | 300 | 5,853 | 19,510,000.00 |
| KR | South Korea | 99,720 | 2,029,706 | 20,354,051.34 |
| QA | Qatar | 11,586 | 347,887 | 30,026,497.50 |
| TW | Taiwan | 35,980 | 1,177,052 | 32,714,063.37 |
| BH | Bahrain | 665 | 69,922 | 105,145,864.66 |
| HK | Hong Kong | 1,042 | 449,589 | 431,467,370.44 |
| SG | Singapore | 683 | 514,837 | 753,787,701.32 |
Sources
US Department of State. 2017. "The World Factbook." Accessed September 21, 2017. https://www.cia.gov/library/publications/the-world-factbook/fields/2147.html.