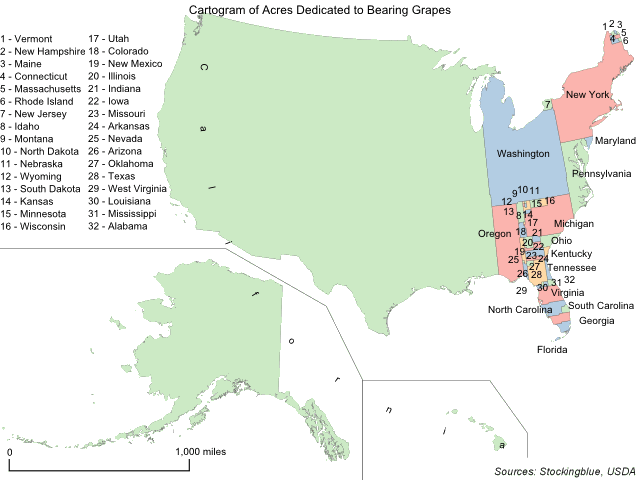
This week, like last year, the focus is on common Thanksgiving foods and which states produce them. The geographically accurate cartogram above redraws the states' sizes based on grape production. Specifically the number of acres dedicated to bearing the fruit. All states except for one, Alaska, produce grapes and of the 49, the USDA publishes complete data on only 47 of them due to the other two states having few producers which would make it easy for their competitors to know how large their operations are.
Findings
- Of the states data is available for, California dedicates the most acres to bearing grapes accounting for just over four-fifths of the nation's total acreage dedicated to the crop.
- While California is responsible for over 82% of acres dedicated to the crop in the country, Washington comes in a distant second with 6%.
- Thirty-three states dedicate less than 1,000 acres to bearing the fruit (in descending order): New Mexico, Illinois, Colorado, New Jersey, Iowa, Minnesota, Arkansas, Tennessee, Arizona, Wisconsin, Maryland, South Carolina, Nebraska, Indiana, Kentucky, Connecticut, Alabama, Oklahoma, Kansas, west Virginia, Mississippi, Massachusetts, Vermont, Louisiana, Rhode Island, New Hampshire, South Dakota, Utah, Nevada, Maine, Montana, Wyoming, and North Dakota.
Caveats
- The agriculture census data is from 2012.
- The following states do produce grapes but the USDA does not release production numbers because there are few operators in the state. It could be that these states are the largest or the smallest producers in the US. The states whose data was not released are Delaware and Hawaii.
- Alaska is not listed as a grape producing state and thus does not show up on the map.
- The choropleth classification is based on Jenks or natural breaks.
- The map is presented in an Albers equal-area conic projection.
- The two insets have the same scale as the main map.
Details
The Western states dedicate 91.45% of the total land dedicated to bearing the crop. The Northeast comes in a very distant second with 4.89% of all the land in the US dedicated to grape production and is followed by the Midwest at 2.03%. The South only dedicates 1.63% of the total.
The total reported area dedicated to the crop in the United States is 1,042,994 acres or 1,629.68 square miles (a bit larger than Rhode Island).
Data
| State | Acres | Percent of US Total |
|---|---|---|
| Alabama | 426 | 0.04 |
| Arizona | 601 | 0.06 |
| Arkansas | 714 | 0.07 |
| California | 864,831 | 82.92 |
| Colorado | 903 | 0.09 |
| Connecticut | 431 | 0.04 |
| Florida | 1,196 | 0.11 |
| Georgia | 1,757 | 0.17 |
| Idaho | 1,290 | 0.12 |
| Illinois | 959 | 0.09 |
| Indiana | 462 | 0.04 |
| Iowa | 760 | 0.07 |
| Kansas | 229 | 0.02 |
| Kentucky | 458 | 0.04 |
| Louisiana | 99 | 0.01 |
| Maine | 39 | 0.00 |
| Maryland | 528 | 0.05 |
| Massachusetts | 191 | 0.02 |
| Michigan | 13,917 | 1.33 |
| Minnesota | 718 | 0.07 |
| Mississippi | 205 | 0.02 |
| Missouri | 1,397 | 0.13 |
| Montana | 32 | 0.00 |
| Nebraska | 467 | 0.04 |
| Nevada | 44 | 0.00 |
| New Hampshire | 76 | 0.01 |
| New Jersey | 791 | 0.08 |
| New Mexico | 964 | 0.09 |
| New York | 36,919 | 3.54 |
| North Carolina | 2,685 | 0.26 |
| North Dakota | 22 | 0.00 |
| Ohio | 1,648 | 0.16 |
| Oklahoma | 340 | 0.03 |
| Oregon | 17,884 | 1.71 |
| Pennsylvania | 11,779 | 1.13 |
| Rhode Island | 94 | 0.01 |
| South Carolina | 497 | 0.05 |
| South Dakota | 66 | 0.01 |
| Tennessee | 645 | 0.06 |
| Texas | 4,052 | 0.39 |
| Utah | 51 | 0.00 |
| Vermont | 132 | 0.01 |
| Virginia | 3,733 | 0.36 |
| Washington | 67,180 | 6.44 |
| West Virginia | 215 | 0.02 |
| Wisconsin | 540 | 0.05 |
| Wyoming | 27 | 0.00 |
Sources
United States Department of Agriculture. 2018. "USDA/NASS QuickStats Ad-Hoc Query Tool." Accessed November 18, 2018. https://quickstats.nass.usda.gov/results/74D22A96-6C00-3E67-BE02-02077A38EA4B.