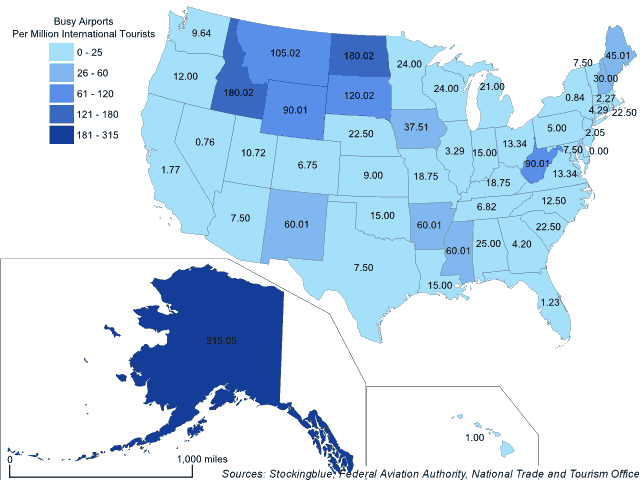
The map above shows the number of airports that serve at least 15,000 passengers per year for every million international tourists each US state receives. Alaska has the most airports for every million international tourists by a large margin.
Findings
- The difference between the state with the greatest number of airports for every tourist, Alaska, and the state with the least (that has busy airports), Nevada, is 314.29 airports per million tourists.
- Alaska has 414.75 times the number of busy airports per tourist that Nevada does.
- The median number of busy airports per million tourists in the US is 14.17 and the mean is 35.35.
Caveats
- Airport data is from 2017.
- Tourist data is from 2012.
- All figures are rounded to the nearest hundredth.
- Fifteen thousand annual passengers amounts to 41 per day, so busy is loosely defined.
- The data for Idaho, North Dakota, South Dakota, and West Virginia indicates the maximum possible number of tourists as the sample size was too small to be accurate.
- The data is based on total number of international tourists to the US in 2012 and distributed among the states based on a survey that was conducted on the first quarter of the same year.
- The map is presented in an Albers equal-area conic projection.
- The choropleth classification is based on Jenks or natural breaks.
Details
Alaska's high number is not surprising as its airports mostly serve the state's population as the state's road network is very limited.
Of the states with more than ten busy airports, only New York has less than one busy airport for every million international tourists. However, it should be noted that one of New York City's international airports is located in New Jersey and that may be the reason for the low number. And aside from New York, only Nevada has less than one busy airport for every million international tourists.
Data
| State | Airports (>15,000 Passengers) | International Tourists |
|---|---|---|
| Alabama | 5 | 199,971 |
| Alaska | 21 | 66,657 |
| Arizona | 9 | 1,199,827 |
| Arkansas | 4 | 66,657 |
| California | 22 | 12,398,207 |
| Colorado | 9 | 1,333,141 |
| Connecticut | 2 | 466,599 |
| Delaware | 0 | 66,657 |
| Florida | 19 | 15,464,430 |
| Georgia | 7 | 1,666,426 |
| Hawaii | 7 | 6,998,988 |
| Idaho | 6 | 33,329 |
| Illinois | 9 | 2,732,938 |
| Indiana | 4 | 266,628 |
| Iowa | 5 | 133,314 |
| Kansas | 3 | 333,285 |
| Kentucky | 5 | 266,628 |
| Louisiana | 7 | 466,599 |
| Maine | 3 | 66,657 |
| Maryland | 3 | 399,942 |
| Massachusetts | 5 | 2,199,682 |
| Michigan | 14 | 666,570 |
| Minnesota | 8 | 333,285 |
| Mississippi | 4 | 66,657 |
| Missouri | 5 | 266,628 |
| Montana | 7 | 66,657 |
| Nebraska | 3 | 133,314 |
| Nevada | 4 | 5,265,905 |
| New Hampshire | 2 | 66,657 |
| New Jersey | 3 | 1,466,455 |
| New Mexico | 4 | 66,657 |
| New York | 16 | 19,130,567 |
| North Carolina | 10 | 799,884 |
| North Dakota | 6 | 33,329 |
| Ohio | 8 | 599,913 |
| Oklahoma | 4 | 266,628 |
| Oregon | 4 | 333,285 |
| Pennsylvania | 9 | 1,799,740 |
| Rhode Island | 3 | 133,314 |
| South Carolina | 6 | 266,628 |
| South Dakota | 4 | 33,329 |
| Tennessee | 5 | 733,227 |
| Texas | 24 | 3,199,537 |
| Utah | 5 | 466,599 |
| Vermont | 1 | 133,314 |
| Virginia | 8 | 599,913 |
| Washington | 9 | 933,198 |
| West Virginia | 3 | 33,329 |
| Wisconsin | 8 | 333,285 |
| Wyoming | 6 | 66,657 |
Sources
Federal Aviation Authority. 2018. "Enplanements of All Commercial Service Airports (by Rank)." Accessed November 26, 2018. https://www.faa.gov/airports/planning_capacity/passenger_allcargo_stats/passenger/media/cy17-commercial-service-enplanements.pdf.
National Trade and Tourism Office. 2018. "International Visitation in the United States." Accessed September 18, 2018. https://travel.trade.gov/outreachpages/inbound.general_information.inbound_overview.html.
National Trade and Tourism Office. 2018. "Survey of International Air Travelers." Accessed September 18, 2018. https://travel.trade.gov/research/programs/ifs/examples.asp.