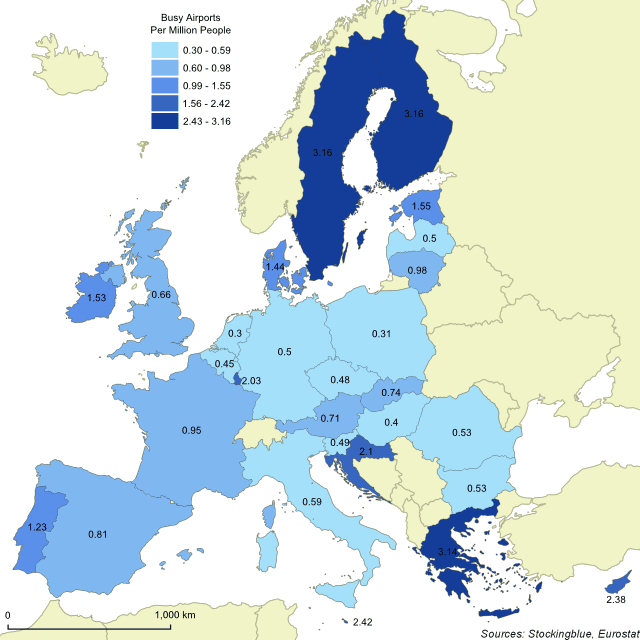
The map above shows the number of airports that serve at least 15,000 passengers per year for every million residents in each EU state. Sweden has the most busy airports per capita.
Findings
- The difference between the state with the greatest number of airports per capita, Sweden, and the state with the least, the Netherlands, is 2.86 airports per million people.
- Sweden has 10.54 times the number of busy airports per capita that the Netherlands does.
- The median number of busy airports per million people in the 28 EU states is 0.78 and the mean is 1.22.
Caveats
- Airport data is from 2016.
- Population data is from 2011.
- All figures are rounded to the nearest hundredth.
- Fifteen thousand annual passengers amounts to 41 per day, so busy is loosely defined.
- The map is presented in an Albers equal-area conic projection.
- The choropleth classification is based on Jenks or natural breaks.
Details
Although France has the greatest number of busy airports, it ranks 13th when taking into account the number of tourists it receives or its population. Romania, on the other hand, which has leads in number of airports per tourist ranks 19th in this metric and has the tenth greatest number of airports in the Union.
Sweden, Finland, and Greece lead in number of busy airports per capita possibly due to the two Nordic states' long and narrow geography and Greece's multitude of islands. These are the only three states with more than three busy airports per million inhabitants. Luxembourg, Croatia, Cyprus, and Malta have more than two airports per million inhabitants while Portugal, Denmark, Ireland, and Estonia each have more than one. It is interesting to see that two geographically large states are followed by geographically small states.
Data
| State | Airports (>15,000 Passengers) | Population |
|---|---|---|
| Austria | 6 | 8,451,860 |
| Belgium | 5 | 11,000,638 |
| Bulgaria | 4 | 7,504,868 |
| Croatia | 9 | 4,284,889 |
| Cyprus | 2 | 840,407 |
| Czech Republic | 5 | 10,505,445 |
| Denmark | 8 | 5,560,628 |
| Estonia | 2 | 1,294,455 |
| Finland | 17 | 5,375,276 |
| France | 62 | 64,932,944 |
| Germany | 41 | 81,751,602 |
| Greece | 34 | 10,816,286 |
| Hungary | 4 | 9,937,628 |
| Ireland | 7 | 4,570,881 |
| Italy | 35 | 59,364,690 |
| Latvia | 1 | 1,986,096 |
| Lithuania | 3 | 3,052,588 |
| Luxembourg | 1 | 493,500 |
| Malta | 1 | 412,970 |
| Netherlands | 5 | 16,655,799 |
| Poland | 12 | 38,538,447 |
| Portugal | 13 | 10,572,721 |
| Romania | 12 | 22,433,741 |
| Slovakia | 4 | 5,397,036 |
| Slovenia | 1 | 2,050,189 |
| Spain | 38 | 46,815,916 |
| Sweden | 30 | 9,482,855 |
| United Kingdom | 43 | 64,853,393 |
Sources
Eurostat. 2018. "Number of Commercial Airports (with More Than 15,000 Passenger Units per Year)." Accessed November 25, 2018. http://appsso.eurostat.ec.europa.eu/nui/show.do?query=BOOKMARK_DS-054100_QID_5E0B9564_UID_-3F171EB0&layout=TIME,C,X,0;GEO,L,Y,0;TRA_INFR,L,Z,0;INDICATORS,C,Z,1;&zSelection=DS-054100TRA_INFR,AIRP;DS-054100INDICATORS,OBS_FLAG;&rankName1=TIME_1_0_0_0&rankName2=TRA-INFR_1_2_-1_2&rankName3=GEO_1_2_0_1&rankName4=INDICATORS_1_2_-1_2&sortC=ASC_-1_FIRST&rStp=&cStp=&rDCh=&cDCh=&rDM=true&cDM=true&footnes=false&empty=false&wai=false&time_mode=NONE&time_most_recent=false&lang=EN&cfo=%23%23%23%2C%23%23%23.%23%23%23.
Eurostat. 2017. "Population on 1 January by Age Groups and Sex - Functional Urban Areas." Accessed December 11, 2017. http://appsso.eurostat.ec.europa.eu/nui/show.do?dataset=urb_lpop1&lang=en.