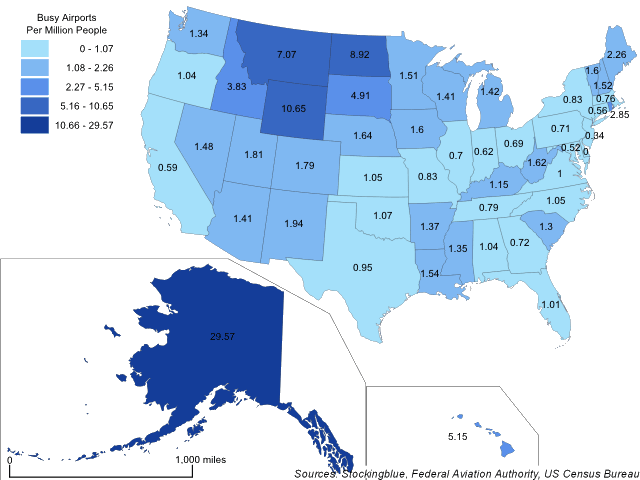
The map above shows the number of airports that serve at least 15,000 passengers per year for every million residents in each US state. Alaska has the most airports per capita by a large margin.
Findings
- The difference between the state with the greatest number of airports per capita, Alaska, and the state with the least (that has busy airports), New Jersey, is 29.23 airports per million people.
- Alaska has 86.65 times the number of busy airports per capita that New Jersey does.
- The median number of busy airports per million people in the 50 US states is 1.34 and the mean is 2.42.
Caveats
- Airport data is from 2017.
- Population data is from 2010.
- All figures are rounded to the nearest hundredth.
- Fifteen thousand annual passengers amounts to 41 per day, so busy is loosely defined.
- The data for Idaho, North Dakota, South Dakota, and West Virginia indicates the maximum possible number of tourists as the sample size was too small to be accurate.
- The data is based on total number of international tourists to the US in 2012 and distributed among the states based on a survey that was conducted on the first quarter of the same year.
- The map is presented in an Albers equal-area conic projection.
- The choropleth classification is based on Jenks or natural breaks.
Details
Alaska has so many busy airports relative to its population because many of its cities and towns are not connected by roads and bush planes make up a relatively large portion of the state's travel. What is surprising to see is that the next grouping of states with a high ratio of busy airports to residents are all located in upper Rocky Mountain states and the Dakotas. Only two other states rival this region's states in this metric: Hawaii and Rhode Island. Hawaii makes sense as it is a cluster of islands.
Alaska is the only state to have many busy airports, many busy airports relative to tourists, and many busy airports in this metric.
Data
| State | Airports (>15,000 Passengers) | Population |
|---|---|---|
| Alabama | 5 | 4,817,786 |
| Alaska | 21 | 710,231 |
| Arizona | 9 | 6,392,017 |
| Arkansas | 4 | 2,915,918 |
| California | 22 | 37,253,956 |
| Colorado | 9 | 5,029,196 |
| Connecticut | 2 | 3,574,097 |
| Delaware | 0 | 897,934 |
| Florida | 19 | 18,801,310 |
| Georgia | 7 | 9,687,653 |
| Hawaii | 7 | 1,360,301 |
| Idaho | 6 | 1,567,582 |
| Illinois | 9 | 12,830,632 |
| Indiana | 4 | 6,483,802 |
| Iowa | 5 | 3,134,693 |
| Kansas | 3 | 2,853,118 |
| Kentucky | 5 | 4,339,367 |
| Louisiana | 7 | 4,533,372 |
| Maine | 3 | 1,328,361 |
| Maryland | 3 | 5,773,552 |
| Massachusetts | 5 | 6,547,629 |
| Michigan | 14 | 9,883,640 |
| Minnesota | 8 | 5,303,925 |
| Mississippi | 4 | 2,967,297 |
| Missouri | 5 | 5,988,927 |
| Montana | 7 | 989,415 |
| Nebraska | 3 | 1,826,341 |
| Nevada | 4 | 2,700,551 |
| New Hampshire | 2 | 1,316,470 |
| New Jersey | 3 | 8,791,894 |
| New Mexico | 4 | 2,059,179 |
| New York | 16 | 19,378,102 |
| North Carolina | 10 | 9,535,483 |
| North Dakota | 6 | 672,591 |
| Ohio | 8 | 11,536,504 |
| Oklahoma | 4 | 3,751,351 |
| Oregon | 4 | 3,831,074 |
| Pennsylvania | 9 | 12,702,379 |
| Rhode Island | 3 | 1,052,567 |
| South Carolina | 6 | 4,625,364 |
| South Dakota | 4 | 814,180 |
| Tennessee | 5 | 6,346,105 |
| Texas | 24 | 25,145,561 |
| Utah | 5 | 2,763,885 |
| Vermont | 1 | 625,741 |
| Virginia | 8 | 8,001,024 |
| Washington | 9 | 6,724,540 |
| West Virginia | 3 | 1,852,994 |
| Wisconsin | 8 | 5,686,986 |
| Wyoming | 6 | 563,626 |
Sources
Federal Aviation Authority. 2018. "Enplanements of All Commercial Service Airports (by Rank)." Accessed November 26, 2018. https://www.faa.gov/airports/planning_capacity/passenger_allcargo_stats/passenger/media/cy17-commercial-service-enplanements.pdf.
United States Census Bureau. September 2012. "United States Summary: 2010: Population and Housing Unit Counts." Accessed January 23, 2018. https://www.census.gov/prod/cen2010/cph-2-1.pdf.