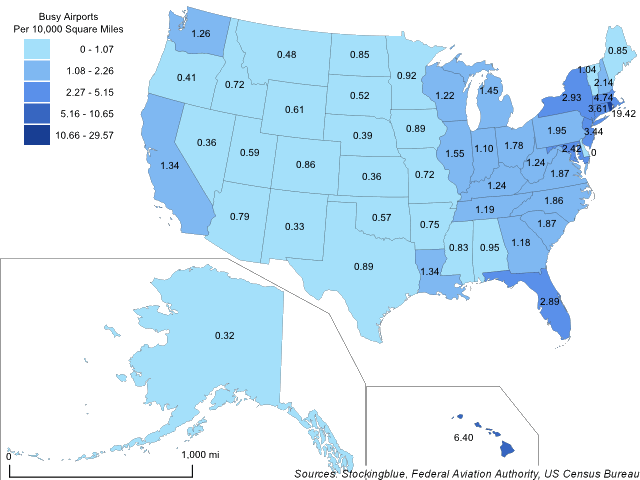
The map above shows the number of airports that serve at least 15,000 passengers per year for every 10,000 square miles in each US state. Rhode Island has the most busy airports per square mile.
Findings
- The difference between the state with the greatest number of airports per square mile, Rhode Island, and the state with the least, Alaska, is 19.10 airports per 10,000 square mile.
- Rhode Island has 61.53 times the number of busy airports per 10,000 square miles that Alaska does.
- The median number of busy airports per 10,000 square miles in the 50 US states is 1.07 and the mean is 1.75.
Caveats
- Airport data is from 2017.
- Area data is from 2010.
- All figures are rounded to the nearest hundredth.
- Fifteen thousand annual passengers amounts to 41 per day, so busy is loosely defined.
- The map is presented in an Albers equal-area conic projection.
- The choropleth classification is based on Jenks or natural breaks.
Details
The top five states in this metric all have areas smaller than 50,000 square miles. New York and Florida are the only states larger than 50,000 square miles that crack the top ten. On the other end, the bottom 15 states all have areas larger than 50,000 square miles (when Delaware which does not have any airports is excluded).
Rhode Island has one airport that serves Block Island and then two on the mainland giving it such a high ratio of airports to area. It also ranks pretty high on number of airports per capita. Alaska on the other hand, does not top the list as it did in airports per tourist and airports per capita. Due to its immensely large size, it actually ends up on the bottom even though it ranks high in total number of airports.
Data
| State | Airports (>15,000 Passengers) | Area (Square Miles) |
|---|---|---|
| Alabama | 5 | 52,420.07 |
| Alaska | 21 | 665,384.04 |
| Arizona | 9 | 113,990.30 |
| Arkansas | 4 | 53,178.55 |
| California | 22 | 163,694.74 |
| Colorado | 9 | 104,093.67 |
| Connecticut | 2 | 5,543.41 |
| Delaware | 0 | 2,488.72 |
| Florida | 19 | 65,757.70 |
| Georgia | 7 | 59,425.15 |
| Hawaii | 7 | 10,931.72 |
| Idaho | 6 | 83,568.95 |
| Illinois | 9 | 57,913.55 |
| Indiana | 4 | 36,419.55 |
| Iowa | 5 | 56,272.81 |
| Kansas | 3 | 82,278.36 |
| Kentucky | 5 | 40,407.80 |
| Louisiana | 7 | 52,378.13 |
| Maine | 3 | 35,379.74 |
| Maryland | 3 | 12,405.93 |
| Massachusetts | 5 | 10,554.39 |
| Michigan | 14 | 96,713.51 |
| Minnesota | 8 | 86,935.83 |
| Mississippi | 4 | 48,431.78 |
| Missouri | 5 | 69,706.99 |
| Montana | 7 | 147,039.71 |
| Nebraska | 3 | 77,347.81 |
| Nevada | 4 | 110,571.82 |
| New Hampshire | 2 | 9,349.16 |
| New Jersey | 3 | 8,722.58 |
| New Mexico | 4 | 121,590.30 |
| New York | 16 | 54,554.98 |
| North Carolina | 10 | 53,819.16 |
| North Dakota | 6 | 70,698.32 |
| Ohio | 8 | 44,825.58 |
| Oklahoma | 4 | 69,898.87 |
| Oregon | 4 | 98,378.54 |
| Pennsylvania | 9 | 46,054.35 |
| Rhode Island | 3 | 1,544.89 |
| South Carolina | 6 | 32,020.49 |
| South Dakota | 4 | 77,115.68 |
| Tennessee | 5 | 42,144.25 |
| Texas | 24 | 268,596.46 |
| Utah | 5 | 84,896.88 |
| Vermont | 1 | 9,616.36 |
| Virginia | 8 | 42,774.93 |
| Washington | 9 | 71,297.95 |
| West Virginia | 3 | 24,230.04 |
| Wisconsin | 8 | 65,496.38 |
| Wyoming | 6 | 97,813.01 |
Sources
Federal Aviation Authority. 2018. "Enplanements of All Commercial Service Airports (by Rank)." Accessed November 26, 2018. https://www.faa.gov/airports/planning_capacity/passenger_allcargo_stats/passenger/media/cy17-commercial-service-enplanements.pdf.
United States Census Bureau. September 2012. "United States Summary: 2010: Population and Housing Unit Counts." Accessed January 23, 2018. https://www.census.gov/prod/cen2010/cph-2-1.pdf.