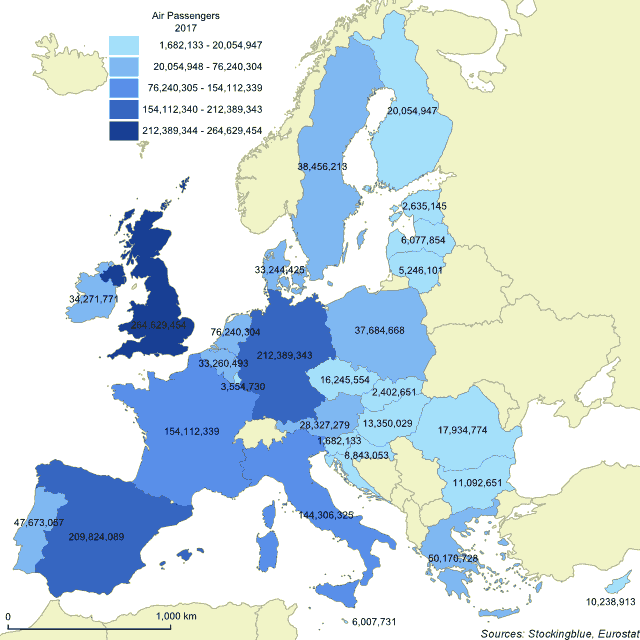
The map above shows the number of passengers that traveled by air in each EU state. The United Kingdom has a commanding lead over every other EU state.
Findings
- The difference between the state with the greatest number of air travelers, the United Kingdom, and the state with the least, Slovenia, is 262,947,321.
- The United Kingdom has 157.32 times the number of air travelers that Slovenia does.
- The median number of air travelers in the 28 EU states is 24,191,113 and the mean is 53,212,741.
Caveats
- Travel data is from 2017.
- All figures are rounded to the nearest hundredth.
- The map is presented in an Albers equal-area conic projection.
- The choropleth classification is based on Jenks or natural breaks.
Details
Germany has two major hub airports that help boost its numbers up above Italy, Spain, and France who all receive more tourists than Germany does. The United Kingdom manages to surpass Germany as well even though the UK receives less tourists than all of the above.
Eastern EU states lag behind the rest of the EU. All states with less than 10 million air travelers, save for Luxembourg and Malta, come from the Eastern EU. These include Croatia, Latvia, Lithuania, Estonia, Slovakia, and Slovenia.
Data
| State | Air Travelers |
|---|---|
| Austria | 28,327,279 |
| Belgium | 33,260,493 |
| Bulgaria | 11,092,651 |
| Croatia | 8,843,053 |
| Cyprus | 10,238,913 |
| Czech Republic | 16,245,554 |
| Denmark | 33,244,425 |
| Estonia | 2,635,145 |
| Finland | 20,054,947 |
| France | 154,112,339 |
| Germany | 212,389,343 |
| Greece | 50,170,728 |
| Hungary | 13,350,029 |
| Ireland | 34,271,771 |
| Italy | 144,306,325 |
| Latvia | 6,077,854 |
| Lithuania | 5,246,101 |
| Luxembourg | 3,554,730 |
| Malta | 6,007,731 |
| Netherlands | 76,240,304 |
| Poland | 37,684,668 |
| Portugal | 47,673,057 |
| Romania | 17,934,774 |
| Slovakia | 2,402,651 |
| Slovenia | 1,682,133 |
| Spain | 209,824,089 |
| Sweden | 38,456,213 |
| United Kingdom | 264,629,454 |
Sources
Eurostat. 2018. "Air Passenger Transport by Reporting Country." Accessed December 12, 2018. http://appsso.eurostat.ec.europa.eu/nui/show.do?query=BOOKMARK_DS-054020_QID_63F2F729_UID_-3F171EB0&layout=TIME,C,X,0;GEO,L,Y,0;UNIT,L,Z,0;TRA_MEAS,L,Z,1;SCHEDULE,L,Z,2;TRA_COV,L,Z,3;INDICATORS,C,Z,4;&zSelection=DS-054020TRA_COV,TOTAL;DS-054020SCHEDULE,TOT;DS-054020UNIT,PAS;DS-054020INDICATORS,OBS_FLAG;DS-054020TRA_MEAS,PAS_CRD;&rankName1=UNIT_1_2_-1_2&rankName2=INDICATORS_1_2_-1_2&rankName3=SCHEDULE_1_2_-1_2&rankName4=TRA-COV_1_2_-1_2&rankName5=TRA-MEAS_1_2_-1_2&rankName6=TIME_1_0_0_0&rankName7=GEO_1_2_0_1&sortC=ASC_-1_FIRST&rStp=&cStp=&rDCh=&cDCh=&rDM=true&cDM=true&footnes=false&empty=false&wai=false&time_mode=NONE&time_most_recent=false&lang=EN&cfo=%23%23%23%2C%23%23%23.%23%23%23.