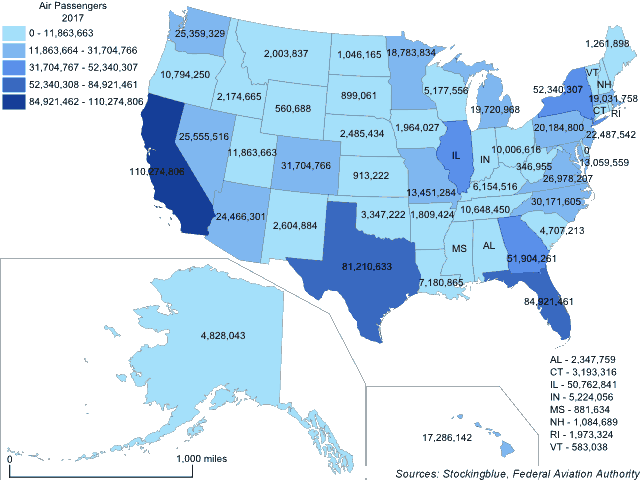
The map above shows the number of passengers that traveled by air in each US state. California has a commanding lead over every other US state.
Findings
- The difference between the state with the greatest number of air travelers, California, and the state with the least (that has commercial airports), West Virginia, is 109,927,851.
- California has 317.84 times the number of air travelers that West Virginia does.
- The median number of air travelers in the 50 US states is 6,667,690 and the mean is 16,954,444.
Caveats
- Travel data is from 2017.
- The map is presented in an Albers equal-area conic projection.
- The choropleth classification is based on Jenks or natural breaks.
Details
Some states share airports and thus air travel may be skewed by the fact that people from one state use an airport in another. One prime example is Delaware whose residents either use airports in Pennsylvania or Maryland bumping up the numbers for those two states. Another is New York and New Jersey. One of New York City's major airports is located just across the border in New Jersey significantly lowering the number of air travelers in the New York data and bumping up New Jersey's number.
The big three are California, Florida, and Texas. Not surprisingly, they are also the three most populous states in the country, although, not in that order.
Data
| State | Air Travelers |
|---|---|
| Alabama | 2,347,759 |
| Alaska | 4,828,043 |
| Arizona | 24,466,301 |
| Arkansas | 1,809,424 |
| California | 110,274,806 |
| Colorado | 31,704,766 |
| Connecticut | 3,193,316 |
| Delaware | 0 |
| Florida | 84,921,461 |
| Georgia | 51,904,261 |
| Hawaii | 17,286,142 |
| Idaho | 2,174,665 |
| Illinois | 50,762,841 |
| Indiana | 5,224,056 |
| Iowa | 1,964,027 |
| Kansas | 913,222 |
| Kentucky | 6,154,516 |
| Louisiana | 7,180,865 |
| Maine | 1,261,898 |
| Maryland | 13,059,559 |
| Massachusetts | 19,031,758 |
| Michigan | 19,720,968 |
| Minnesota | 18,783,834 |
| Mississippi | 881,634 |
| Missouri | 13,451,284 |
| Montana | 2,003,837 |
| Nebraska | 2,485,434 |
| Nevada | 25,555,516 |
| New Hampshire | 1,084,689 |
| New Jersey | 22,487,542 |
| New Mexico | 2,604,884 |
| New York | 52,340,307 |
| North Carolina | 30,171,605 |
| North Dakota | 1,046,165 |
| Ohio | 10,006,616 |
| Oklahoma | 3,347,022 |
| Oregon | 10,794,250 |
| Pennsylvania | 20,184,800 |
| Rhode Island | 1,973,324 |
| South Carolina | 4,707,213 |
| South Dakota | 899,061 |
| Tennessee | 10,648,450 |
| Texas | 81,210,633 |
| Utah | 11,863,663 |
| Vermont | 583,038 |
| Virginia | 26,978,207 |
| Washington | 25,359,329 |
| West Virginia | 346,955 |
| Wisconsin | 5,177,556 |
| Wyoming | 560,688 |
Sources
Federal Aviation Authority. 2018. "Enplanements of All Commercial Service Airports (by Rank)." Accessed November 26, 2018. https://www.faa.gov/airports/planning_capacity/passenger_allcargo_stats/passenger/media/cy17-commercial-service-enplanements.pdf.