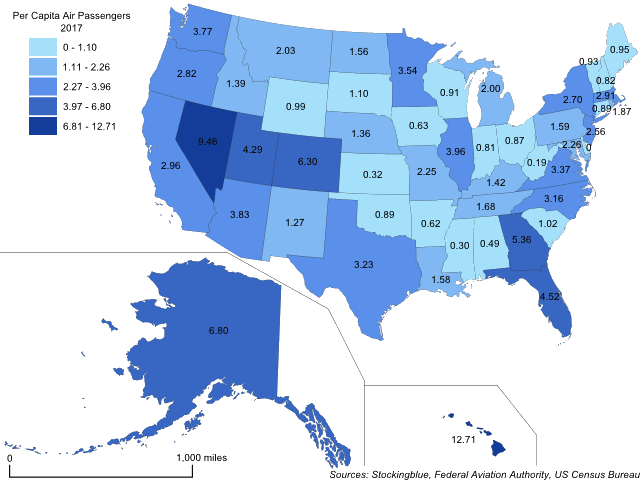
The map above shows the number of passengers that traveled by air for every resident in each US state. Hawaii is the only state to have more than ten air passengers for every resident in the state.
Findings
- The difference between the state with the greatest number of per capita air travelers, Hawaii, and the state with the least (that has commercial airports), West Virginia, is 12.52.
- Hawaii has 67.87 times the number of per capita air travelers that West Virginia does.
- The median number of per capita air travelers in the 50 US states is 1.63 and the mean is 2.46.
Caveats
- Travel data is from 2017.
- Population data is from 2010.
- All figures are rounded to the nearest hundredth.
- The map is presented in an Albers equal-area conic projection.
- The choropleth classification is based on Jenks or natural breaks.
Details
California which has the most air travelers overall, ranks 15th when its population is taken into account. The other two leaders in the overall metric, Florida and Texas, rank sixth and 13th in this metric, respectively.
Sixteen states have less air passengers than population (in descending order of per capita passengers): Wyoming, Maine, Vermont, Wisconsin, Connecticut, Oklahoma, Ohio, New Hampshire, Indiana, Iowa, Arkansas, Alabama, Kansas, Mississippi, West Virginia, and Delaware. West Virginia and Delaware have the dubious distinction of ranking in the final two both in overall passengers (49th and 50th respectively) and per capita passengers (49th and 50th respectively).
Of the seven states with a population over 10 million, Florida has more than four times its population in air travelers, Illinois and Texas have more than three, California and New York have more than two, Pennsylvania has more than one, and Ohio has less than one.
Of the six states with more than 50 million air passengers, Georgia has more than five times its population in air travelers. Florida has more than four, Illinois and Texas have more than three, and California and New York have more than two.
Georgia is the only state to rank in the top five in both overall air passengers and per capita air passengers. Florida and Illinois are the only other two to rank in the top ten in both metrics.
Alaska rises the most spots when comparing per capita air travelers to total air travelers. It ranks 29th in total air travelers, but rises up to third when its population is taken into account, thus rising 26 spots. On the other end, Ohio drops the most as it ranks 24th in total air travelers but only 41st in per capita air travelers, thus dropping 17 spots.
Data
| State | Air Travelers | Population |
|---|---|---|
| Alabama | 2,347,759 | 4,817,786 |
| Alaska | 4,828,043 | 710,231 |
| Arizona | 24,466,301 | 6,392,017 |
| Arkansas | 1,809,424 | 2,915,918 |
| California | 110,274,806 | 37,253,956 |
| Colorado | 31,704,766 | 5,029,196 |
| Connecticut | 3,193,316 | 3,574,097 |
| Delaware | 0 | 897,934 |
| Florida | 84,921,461 | 18,801,310 |
| Georgia | 51,904,261 | 9,687,653 |
| Hawaii | 17,286,142 | 1,360,301 |
| Idaho | 2,174,665 | 1,567,582 |
| Illinois | 50,762,841 | 12,830,632 |
| Indiana | 5,224,056 | 6,483,802 |
| Iowa | 1,964,027 | 3,134,693 |
| Kansas | 913,222 | 2,853,118 |
| Kentucky | 6,154,516 | 4,339,367 |
| Louisiana | 7,180,865 | 4,533,372 |
| Maine | 1,261,898 | 1,328,361 |
| Maryland | 13,059,559 | 5,773,552 |
| Massachusetts | 19,031,758 | 6,547,629 |
| Michigan | 19,720,968 | 9,883,640 |
| Minnesota | 18,783,834 | 5,303,925 |
| Mississippi | 881,634 | 2,967,297 |
| Missouri | 13,451,284 | 5,988,927 |
| Montana | 2,003,837 | 989,415 |
| Nebraska | 2,485,434 | 1,826,341 |
| Nevada | 25,555,516 | 2,700,551 |
| New Hampshire | 1,084,689 | 1,316,470 |
| New Jersey | 22,487,542 | 8,791,894 |
| New Mexico | 2,604,884 | 2,059,179 |
| New York | 52,340,307 | 19,378,102 |
| North Carolina | 30,171,605 | 9,535,483 |
| North Dakota | 1,046,165 | 672,591 |
| Ohio | 10,006,616 | 11,536,504 |
| Oklahoma | 3,347,022 | 3,751,351 |
| Oregon | 10,794,250 | 3,831,074 |
| Pennsylvania | 20,184,800 | 12,702,379 |
| Rhode Island | 1,973,324 | 1,052,567 |
| South Carolina | 4,707,213 | 4,625,364 |
| South Dakota | 899,061 | 814,180 |
| Tennessee | 10,648,450 | 6,346,105 |
| Texas | 81,210,633 | 25,145,561 |
| Utah | 11,863,663 | 2,763,885 |
| Vermont | 583,038 | 625,741 |
| Virginia | 26,978,207 | 8,001,024 |
| Washington | 25,359,329 | 6,724,540 |
| West Virginia | 346,955 | 1,852,994 |
| Wisconsin | 5,177,556 | 5,686,986 |
| Wyoming | 560,688 | 563,626 |
Sources
Federal Aviation Authority. 2018. "Enplanements of All Commercial Service Airports (by Rank)." Accessed November 26, 2018. https://www.faa.gov/airports/planning_capacity/passenger_allcargo_stats/passenger/media/cy17-commercial-service-enplanements.pdf.
United States Census Bureau. September 2012. "United States Summary: 2010: Population and Housing Unit Counts." Accessed January 23, 2018. https://www.census.gov/prod/cen2010/cph-2-1.pdf.