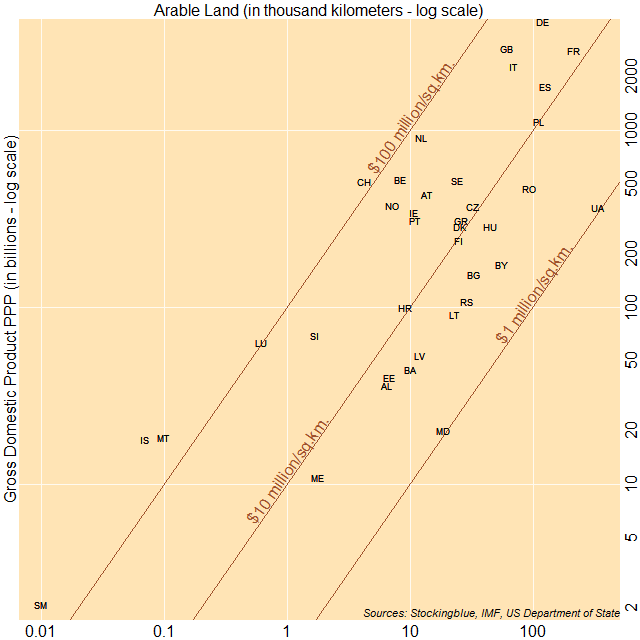
The chart above shows economic output as it relates to arable land. The countries to the top left have a larger ratio of gross domestic product (GDP) to arable land, while countries to the bottom right have a smaller ratio of GDP to arable land. Iceland, San Marino, and Malta have the largest ratio of GDP to area whereas Moldova, Ukraine, and Belarus have the smallest ratio of GDP to area.
Findings
- Five countries have a GDP per square kilometer of arable land of over 100 million international dollars.
- Moldova has the smallest ratio of GDP to arable land with an economy of just over one million times that of its arable land in square kilometers.
- Iceland has the largest ratio of GDP to arable land with an economy of over 254 million times that of its arable land in square kilometers.
- Iceland went from having the smallest ratio of GDP to total land area to the highest ratio when only arable land is factored in.
Caveats
- Arable land may be a better attribute to use than total land area because it indicates where people are willing to live however, countries are likely to have resources beyond what can be found within their arable lands.
- Andorra, Gibraltar, Guernsey, Vatican City, Isle of Man, Jersey, Liechtenstein, the Former Yugoslav Republic of Macedonia, Monaco, Russia, Slovakia were missing data.
Details
Iceland makes quite the transition as when its GDP is compared to total land the country has the smallest ratio, but when compared only to arable land, it has the largest ratio.
Once again, former Soviet republics do not fare so well. The twelve worst performers are all either former Soviet republics or Balkan states.
Data
| Code | Country | Arable Land (square km) | GDP (in millions) | GDP Per Square Kilometer |
|---|---|---|---|---|
| MD | Moldova | 18,679 | 20,207 | 1,081,803 |
| UA | Ukraine | 338,619 | 368,047 | 1,086,906 |
| BY | Belarus | 56,467 | 173,405 | 3,070,909 |
| RS | Serbia | 29,218 | 107,131 | 3,666,610 |
| LT | Lithuania | 22,790 | 90,387 | 3,966,082 |
| BA | Bosnia and Herzegovina | 10,086 | 44,462 | 4,408,289 |
| LV | Latvia | 12,016 | 53,268 | 4,433,089 |
| BG | Bulgaria | 33,159 | 152,079 | 4,586,357 |
| RO | Romania | 93,214 | 470,312 | 5,045,508 |
| AL | Albania | 6,515 | 36,198 | 5,556,101 |
| EE | Estonia | 6,735 | 40,275 | 5,979,955 |
| ME | Montenegro | 1,784 | 10,934 | 6,128,924 |
| HU | Hungary | 45,105 | 284,266 | 6,302,317 |
| FI | Finland | 25,019 | 239,662 | 9,579,200 |
| PL | Poland | 113,197 | 1,114,105 | 9,842,178 |
| HR | Croatia | 9,056 | 100,006 | 11,043,065 |
| DK | Denmark | 25,386 | 284,040 | 11,188,844 |
| CZ | Czech Republic | 32,349 | 368,659 | 11,396,303 |
| GR | Greece | 26,004 | 302,150 | 11,619,366 |
| FR | France | 215,029 | 2,833,064 | 13,175,265 |
| ES | Spain | 125,845 | 1,768,816 | 14,055,513 |
| SE | Sweden | 24,019 | 522,849 | 21,768,142 |
| PT | Portugal | 10,960 | 310,651 | 28,344,069 |
| AT | Austria | 13,844 | 432,424 | 31,235,481 |
| IE | Ireland | 10,826 | 343,682 | 31,745,982 |
| IT | Italy | 68,697 | 2,303,108 | 33,525,598 |
| DE | Germany | 121,737 | 4,134,668 | 33,963,939 |
| SI | Slovenia | 1,706 | 69,358 | 40,655,334 |
| GB | United Kingdom | 61,144 | 2,905,392 | 47,517,205 |
| NO | Norway | 7,124 | 377,100 | 52,933,745 |
| BE | Belgium | 8,296 | 529,289 | 63,800,506 |
| NL | Netherlands | 12,367 | 907,619 | 73,390,394 |
| LU | Luxembourg | 620 | 63,549 | 102,498,387 |
| CH | Switzerland | 4,213 | 514,162 | 122,041,775 |
| MT | Malta | 99 | 18,404 | 185,898,990 |
| SM | San Marino | 10 | 2,093 | 209,300,000 |
| IS | Iceland | 70 | 17,846 | 254,942,857 |
Sources
US Department of State. 2017. "The World Factbook." Accessed September 21, 2017. https://www.cia.gov/library/publications/the-world-factbook/fields/2147.html.