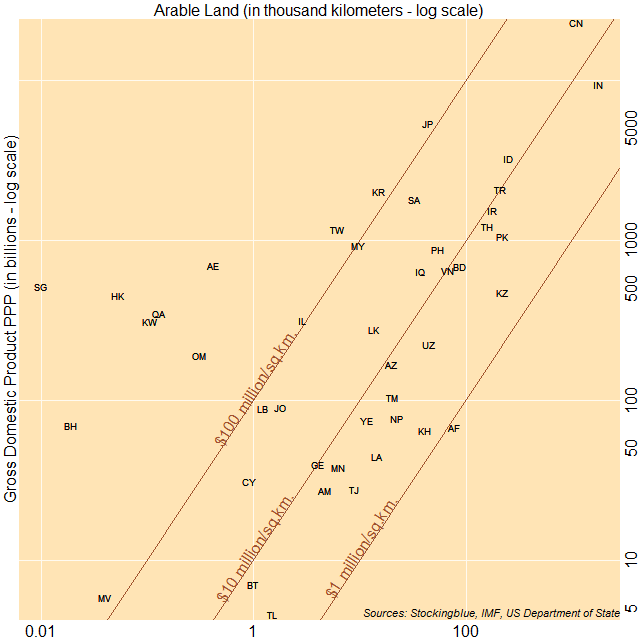
The chart above shows economic output as it relates to arable land. The countries to the top left have a larger ratio of gross domestic product (GDP) to arable land, while countries to the bottom right have a smaller ratio of GDP to arable land. Singapore, Hong Kong, and Bahrain have the largest ratio of GDP to area whereas Afghanistan, Cambodia, and Kazakhstan have the smallest ratio of GDP to area.
Findings
- Six countries have a GDP per square kilometer of arable land of over one billion international dollars.
- Afghanistan has the smallest ratio of GDP to arable land with an economy of just over 800,000 times that of its arable land in square kilometers.
- Singapore has the largest ratio of GDP to arable land with an economy of over 51 billion times that of its arable land in square kilometers.
- Afghanistan is also the only country with a GDP per square kilometer of under one million international dollars.
Caveats
- Arable land may be a better attribute to use than total land area because it indicates where people are willing to live however, countries are likely to have resources beyond what can be found within their arable lands.
- British Indian Ocean Territory, Brunei Darussalam, Christmas Island, Cocos (Keeling) Islands, North Korea, Kyrgyzstan, Macao, Myanmar, Palestine, and Syria were missing data.
Details
South and Central Asian countries do not fare so well in this metric. Seven out of the ten worst performers come from this part of Asia. Countries from the Arabic peninsula however, fare much better, partly due to the fact that they have so little arable land.
Aside from small states and countries from very arid regions, South Korea and Japan are the best performers on this metric.
Data
| Code | Country | Arable Land (square km) | GDP (in millions) | GDP Per Square Kilometer |
|---|---|---|---|---|
| AF | Afghanistan | 77,612 | 67,462 | 869,221.25 |
| KH | Cambodia | 41,087 | 64,405 | 1,567,527.44 |
| KZ | Kazakhstan | 221,059 | 472,563 | 2,137,723.41 |
| LA | Laos | 14,682 | 44,639 | 3,040,389.59 |
| TL | Timor-Leste | 1,502 | 4,567 | 3,040,612.52 |
| TJ | Tajikistan | 8,790 | 27,802 | 3,162,912.4 |
| NP | Nepal | 22,227 | 77,147 | 3,470,868.76 |
| PK | Pakistan | 219,724 | 1,060,569 | 4,826,823.65 |
| UZ | Uzbekistan | 45,187 | 222,792 | 4,930,444.6 |
| TM | Turkmenistan | 20,008 | 103,987 | 5,197,271.09 |
| IN | India | 1,753,694 | 9,489,302 | 5,411,036.36 |
| AM | Armenia | 4,693 | 27,116 | 5,777,967.19 |
| MN | Mongolia | 6,256 | 37,731 | 6,031,170.08 |
| YE | Yemen | 11,616 | 74,250 | 6,392,045.45 |
| BT | Bhutan | 998 | 7,045 | 7,059,118.24 |
| TH | Thailand | 158,035 | 1,226,407 | 7,760,350.56 |
| BD | Bangladesh | 87,615 | 686,598 | 7,836,534.84 |
| AZ | Azerbaijan | 19,745 | 167,431 | 8,479,665.74 |
| IR | Iran | 178,006 | 1,535,491 | 8,626,063.17 |
| VN | Vietnam | 68,227 | 648,243 | 9,501,267.83 |
| GE | Georgia | 4,043 | 39,318 | 9,724,956.72 |
| TR | Turkey | 209,211 | 2,082,079 | 9,952,053.19 |
| ID | Indonesia | 247,598 | 3,257,123 | 13,154,884.13 |
| PH | Philippines | 54,600 | 878,980 | 16,098,534.8 |
| IQ | Iraq | 36,817 | 641,005 | 17,410,571.2 |
| LK | Sri Lanka | 13,579 | 278,415 | 20,503,350.76 |
| CN | China | 1,084,461 | 23,194,411 | 21,387,962.31 |
| CY | Cyprus | 906 | 31,093 | 34,318,984.55 |
| JO | Jordan | 1,787 | 89,555 | 50,114,717.4 |
| SA | Saudi Arabia | 32,250 | 1,796,205 | 55,696,279.07 |
| LB | Lebanon | 1,238 | 88,786 | 71,717,285.95 |
| MY | Malaysia | 9,567 | 922,057 | 96,378,906.66 |
| IL | Israel | 2,850 | 316,120 | 110,919,298.25 |
| JP | Japan | 44,226 | 5,420,228 | 122,557,500.11 |
| KR | South Korea | 15,254 | 2,029,706 | 133,060,574.28 |
| MV | Maldives | 40 | 5,853 | 146,325,000 |
| TW | Taiwan | 6,084 | 1,177,052 | 193,466,798.16 |
| OM | Oman | 310 | 189,582 | 611,554,838.71 |
| AE | United Arab Emirates | 418 | 693,765 | 1,659,724,880.38 |
| QA | Qatar | 128 | 347,887 | 2,717,867,187.5 |
| KW | Kuwait | 106 | 309,640 | 2,921,132,075.47 |
| BH | Bahrain | 19 | 69,922 | 3,680,105,263.16 |
| HK | Hong Kong | 53 | 449,589 | 8,482,811,320.75 |
| SG | Singapore | 10 | 514,837 | 51,483,700,000 |
Sources
US Department of State. 2017. "The World Factbook." Accessed September 21, 2017. https://www.cia.gov/library/publications/the-world-factbook/fields/2147.html.