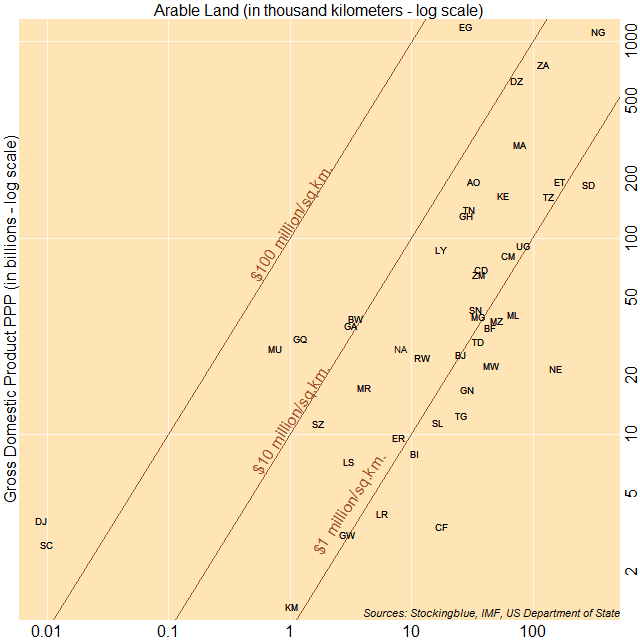
The chart above shows economic output as it relates to arable land. The countries to the top left have a larger ratio of gross domestic product (GDP) to arable land, while countries to the bottom right have a smaller ratio of GDP to arable land. Singapore, Hong Kong, and Bahrain have the largest ratio of GDP to area whereas Afghanistan, Cambodia, and Kazakhstan have the smallest ratio of GDP to area.
Findings
- Two countries have a GDP per square kilometer of arable land of over 100 million international dollars.
- Niger has the smallest ratio of GDP to arable land with an economy of just over 138,000 times that of its arable land in square kilometers.
- Djibouti has the largest ratio of GDP to arable land with an economy of over 406 million times that of its arable land in square kilometers.
- Only seven countries make over 10 million international dollars per square kilometer of arable land.
Caveats
- Arable land may be a better attribute to use than total land area because it indicates where people are willing to live however, countries are likely to have resources beyond what can be found within their arable lands.
- Cape Verde, Congo, Ivory Coast, Gambia, Mayotte, Réunion, Sao Tome and Principe, Somalia, South Sudan, Western Sahara, and Zimbabwe were missing data.
Details
As has been the case with previous metrics studied, there are no geographic clusters on this continent, unlike Europe and Asia. Countries that do well in this metric come from every corner of the continent and the same goes for countries that do not do so well.
The only surprising thing is that Egypt doesn't dominate here as it has very little arable land and a large population with a sizable GDP.
Data
| Code | Country | Arable Land (square km) | GDP (in millions) | GDP Per Square Kilometer |
|---|---|---|---|---|
| NE | Niger | 155,841 | 21,655 | 138,955.73 |
| CF | Central African Republic | 18,067 | 3,411 | 188,797.25 |
| TG | Togo | 25,674 | 12,494 | 486,640.18 |
| MW | Malawi | 45,267 | 22,577 | 498,751.85 |
| GN | Guinea | 29,016 | 17,056 | 587,813.62 |
| ML | Mali | 69,451 | 40,974 | 589,969.91 |
| SD | Sudan | 292,566 | 186,715 | 638,197.88 |
| LR | Liberia | 5,793 | 3,960 | 683,583.64 |
| SL | Sierra Leone | 16,778 | 11,551 | 688,461.08 |
| BI | Burundi | 10,814 | 8,024 | 742,001.11 |
| MZ | Mozambique | 51,162 | 38,000 | 742,738.75 |
| BF | Burkina Faso | 44,710 | 35,000 | 782,822.63 |
| TD | Chad | 35,258 | 29,730 | 843,212.89 |
| BJ | Benin | 25,785 | 25,407 | 985,340.31 |
| GW | Guinea-Bissau | 2,960 | 3,089 | 1,043,581.08 |
| UG | Uganda | 82,663 | 91,212 | 1,103,419.91 |
| MG | Madagascar | 35,220 | 40,055 | 1,137,279.95 |
| ET | Ethiopia | 167,854 | 194,980 | 1,161,604.73 |
| TZ | Tanzania | 135,464 | 163,522 | 1,207,125.14 |
| ER | Eritrea | 7,997 | 9,678 | 1,210,203.83 |
| SN | Senegal | 34,226 | 43,326 | 1,265,879.74 |
| KM | Comoros | 1,046 | 1,329 | 1,270,554.49 |
| CM | Cameroon | 62,277 | 81,535 | 1,309,231.34 |
| ZM | Zambia | 36,125 | 65,000 | 1,799,307.96 |
| CD | Democratic Republic of the Congo | 37,518 | 69,000 | 1,839,117.22 |
| RW | Rwanda | 12,361 | 24,717 | 1,999,595.5 |
| LS | Lesotho | 3,066 | 7,287 | 2,376,712.33 |
| KE | Kenya | 56,879 | 164,340 | 2,889,291.3 |
| NG | Nigeria | 344,577 | 1,124,627 | 3,263,790.1 |
| NA | Namibia | 8,243 | 27,451 | 3,330,219.58 |
| MA | Morocco | 78,155 | 300,556 | 3,845,640.07 |
| MR | Mauritania | 4,124 | 17,421 | 4,224,296.8 |
| GH | Ghana | 28,393 | 130,000 | 4,578,593.32 |
| TN | Tunisia | 29,939 | 139,000 | 4,642,773.64 |
| LY | Libya | 17,595 | 87,067 | 4,948,394.43 |
| AO | Angola | 33,038 | 193,935 | 5,870,058.72 |
| ZA | South Africa | 120,691 | 761,926 | 6,313,030.8 |
| SZ | Swaziland | 1,701 | 11,352 | 6,673,721.34 |
| DZ | Algeria | 73,833 | 634,746 | 8,597,050.1 |
| BW | Botswana | 3,492 | 39,000 | 11,168,384.88 |
| GA | Gabon | 3,212 | 36,000 | 11,207,970.11 |
| GQ | Equatorial Guinea | 1,208 | 30,807 | 25,502,483.44 |
| MU | Mauritius | 764 | 27,507 | 36,003,926.7 |
| EG | Egypt | 28,042 | 1,197,967 | 42,720,455.03 |
| SC | Seychelles | 10 | 2,761 | 276,100,000 |
| DJ | Djibouti | 9 | 3,658 | 406,444,444.44 |
Sources
US Department of State. 2017. "The World Factbook." Accessed September 21, 2017. https://www.cia.gov/library/publications/the-world-factbook/fields/2147.html.