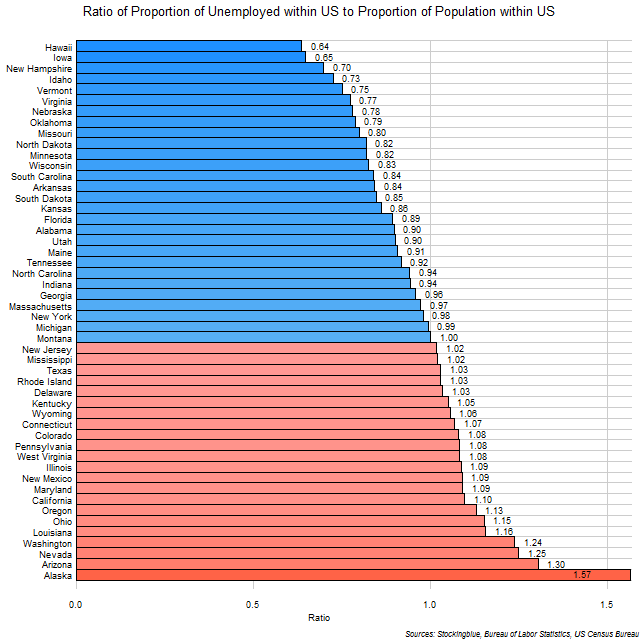
The chart above shows the ratio of the state's proportion of unemployed people in the US to the state's proportion of total people in the US. Twenty-two states have an unemployed population that makes up a larger proportion of the US total than their total population does. For instance, Arizona's unemployed account for 2.70% of the total unemployed people in the US whereas Arizona's population only accounts for 2.07% of the total US population, thus its ratio of unemployed within the US to total people within the US is 1.30.
Findings
- The difference between the state with the lowest ratio of unemployed within the US to people within the US, Hawaii, and the state with the highest, Alaska, is 0.93.
- Hawaii has 0.41 times the ratio that Alaska does.
- Montana is the only state whose unemployed and total population make up the same percentage of the US's unemployed and total population respectively.
Caveats
- Unemployment data is from December 2018.
- Population data is from 2010.
- All figures are rounded to the nearest hundredth.
Details
Four states each make up more than five percent of the US's unemployed population: California, Texas, New York, and Florida. These same four states are the only ones whose population makes up over five percent of the US's population.
Only Alaska has an unemployed population that is more than one-and-a-half times the size of its total population when compared to the US totals. On the flip side, Hawaii's unemployed population as a percent of the US's makes up only a two-thirds of its total population as a percent of the US as a whole.
Data
| State | Unemployed | Population | Percent of US Unemployed | Percent of US Population |
|---|---|---|---|---|
| Alabama | 86,023 | 4,817,786 | 1.4 | 1.56 |
| Alaska | 22,390 | 710,231 | 0.36 | 0.23 |
| Arizona | 165,508 | 6,392,017 | 2.7 | 2.07 |
| Arkansas | 49,111 | 2,915,918 | 0.8 | 0.95 |
| California | 813,858 | 37,253,956 | 13.25 | 12.08 |
| Colorado | 107,888 | 5,029,196 | 1.76 | 1.63 |
| Connecticut | 76,220 | 3,574,097 | 1.24 | 1.16 |
| Delaware | 18,175 | 897,934 | 0.3 | 0.29 |
| Florida | 334,552 | 18,801,310 | 5.45 | 6.1 |
| Georgia | 184,632 | 9,687,653 | 3.01 | 3.14 |
| Hawaii | 16,900 | 1,360,301 | 0.28 | 0.44 |
| Idaho | 22,581 | 1,567,582 | 0.37 | 0.51 |
| Illinois | 277,518 | 12,830,632 | 4.52 | 4.16 |
| Indiana | 121,865 | 6,483,802 | 1.98 | 2.1 |
| Iowa | 40,631 | 3,134,693 | 0.66 | 1.02 |
| Kansas | 48,972 | 2,853,118 | 0.8 | 0.93 |
| Kentucky | 90,987 | 4,339,367 | 1.48 | 1.41 |
| Louisiana | 104,350 | 4,533,372 | 1.7 | 1.47 |
| Maine | 24,017 | 1,328,361 | 0.39 | 0.43 |
| Maryland | 125,219 | 5,773,552 | 2.04 | 1.87 |
| Massachusetts | 126,215 | 6,547,629 | 2.06 | 2.12 |
| Michigan | 195,680 | 9,883,640 | 3.19 | 3.21 |
| Minnesota | 86,683 | 5,303,925 | 1.41 | 1.72 |
| Mississippi | 60,121 | 2,967,297 | 0.98 | 0.96 |
| Missouri | 95,242 | 5,988,927 | 1.55 | 1.94 |
| Montana | 19,425 | 989,415 | 0.32 | 0.32 |
| Nebraska | 28,472 | 1,826,341 | 0.46 | 0.59 |
| Nevada | 67,457 | 2,700,551 | 1.1 | 0.88 |
| New Hampshire | 18,719 | 1,316,470 | 0.3 | 0.43 |
| New Jersey | 178,097 | 8,791,894 | 2.9 | 2.85 |
| New Mexico | 44,851 | 2,059,179 | 0.73 | 0.67 |
| New York | 378,512 | 19,378,102 | 6.16 | 6.29 |
| North Carolina | 178,436 | 9,535,483 | 2.91 | 3.09 |
| North Dakota | 10,827 | 672,591 | 0.18 | 0.22 |
| Ohio | 264,830 | 11,536,504 | 4.31 | 3.74 |
| Oklahoma | 59,073 | 3,751,351 | 0.96 | 1.22 |
| Oregon | 85,905 | 3,831,074 | 1.4 | 1.24 |
| Pennsylvania | 273,620 | 12,702,379 | 4.46 | 4.12 |
| Rhode Island | 21,662 | 1,052,567 | 0.35 | 0.34 |
| South Carolina | 77,087 | 4,625,364 | 1.26 | 1.5 |
| South Dakota | 13,525 | 814,180 | 0.22 | 0.26 |
| Tennessee | 116,136 | 6,346,105 | 1.89 | 2.06 |
| Texas | 515,093 | 25,145,561 | 8.39 | 8.16 |
| Utah | 49,946 | 2,763,885 | 0.81 | 0.9 |
| Vermont | 9,182 | 625,741 | 0.15 | 0.2 |
| Virginia | 123,180 | 8,001,024 | 2.01 | 2.6 |
| Washington | 165,727 | 6,724,540 | 2.7 | 2.18 |
| West Virginia | 40,104 | 1,852,994 | 0.65 | 0.6 |
| Wisconsin | 93,384 | 5,686,986 | 1.52 | 1.84 |
| Wyoming | 11,619 | 563,626 | 0.19 | 0.18 |
Sources
Bureau of Labor Statistics. 2019. "State Employment and Unemployment (Monthly) News Release." Accessed February 6, 2019. https://www.bls.gov/news.release/archives/laus_01182019.htm.
United States Census Bureau. September 2012. "United States Summary: 2010: Population and Housing Unit Counts." Accessed January 23, 2018. https://www.census.gov/prod/cen2010/cph-2-1.pdf.