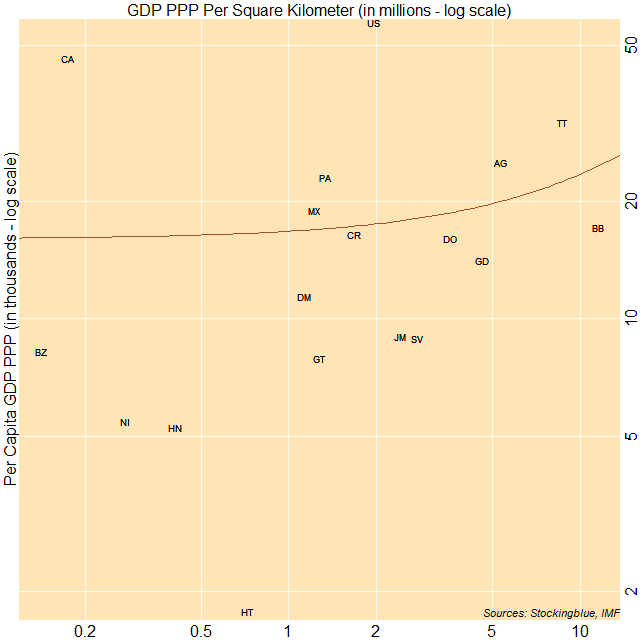
The correlation between per capita gross domestic product based on purchasing power parity (GDP PPP) and GDP PPP per area in North America is almost nonexistent. The three largest economies on a per capita basis have either a very low, moderate, or high per area GDP.
Findings
- The correlation coefficient between per capita Gross Domestic Product (GDP) in Purchasing Power Parity (PPP) and minimum wage in North America is 0.16.
- As the per capita GDP PPP increases in North America, the per area GDP PPP does not necessarily increase.
- Haiti has the lowest per capita GDP PPP but only the fifth lowest per area GDP PPP.
- Belize has the lowest per area GDP PPP but only the fifth lowest per capita GDP PPP.
- The United States has the largest per capita GDP PPP but the eighth highest per area GDP PPP on the continent.
- Barbados on the other hand, has the highest per area GDP PPP but only the seventh highest per capita GDP PPP.
Caveats
- As always, correlation does not imply causation.
- Anguilla, Aruba, Bahamas, Bermuda, Cayman Islands, Cuba, Curacao, Greenland, Guadeloupe, Martinique, Montserrat, Puerto Rico, Saint Barthelemy, Saint Kitts and Nevis, Saint Lucia, Saint Martin, Saint Pierre and Miquelon, Saint Vincent and the Grenadines, Sint Maarten, Turks and Caicos Islands, the British Virgin Islands, and the US Virgin Islands were missing data.
Details
Every country that has a per capita GDP PPP of at least 10,000 international dollars save for Canada, also has a GDP PPP per square kilometer of at least one million international dollars. However, there are several countries (Guatemala, Jamaica, El Salvador) with a per capita GDP PPP below 10,000 international dollars that have a GDP PPP per square kilometer of at least one million international dollars.
Canada is the only country on the continent with a sub one million international dollar GDP PPP per square kilometer that has a per capita GDP PPP of over 10,000 international dollars.
Country Codes
| Code | Country | GDP PPP Per Square Kilometer | Per Capita GDP PPP |
|---|---|---|---|
| AG | Antigua and Barbuda | 5,354,401.81 | 25,157 |
| BB | Barbados | 11,561,484.92 | 17,100 |
| BZ | Belize | 141,600.63 | 8,220 |
| CA | Canada | 175,560.13 | 46,437 |
| CR | Costa Rica | 1,678,688.85 | 16,436 |
| DM | Dominica | 1,127,829.56 | 11,375 |
| DO | Dominican Republic | 3,578,795.97 | 16,049 |
| SV | El Salvador | 2,764,720.08 | 8,909 |
| GD | Grenada | 4,616,279.07 | 14,116 |
| GT | Guatemala | 1,276,409.92 | 7,899 |
| HT | Haiti | 719,963.96 | 1,784 |
| HN | Honduras | 407,065.75 | 5,271 |
| JM | Jamaica | 2,408,698.03 | 8,976 |
| MX | Mexico | 1,224,918.36 | 18,938 |
| NI | Nicaragua | 274,871.52 | 5,452 |
| PA | Panama | 1,332,696.9 | 23,024 |
| TT | Trinidad and Tobago | 8,707,878.32 | 31,870 |
| US | United States | 1,974,587.93 | 57,436 |