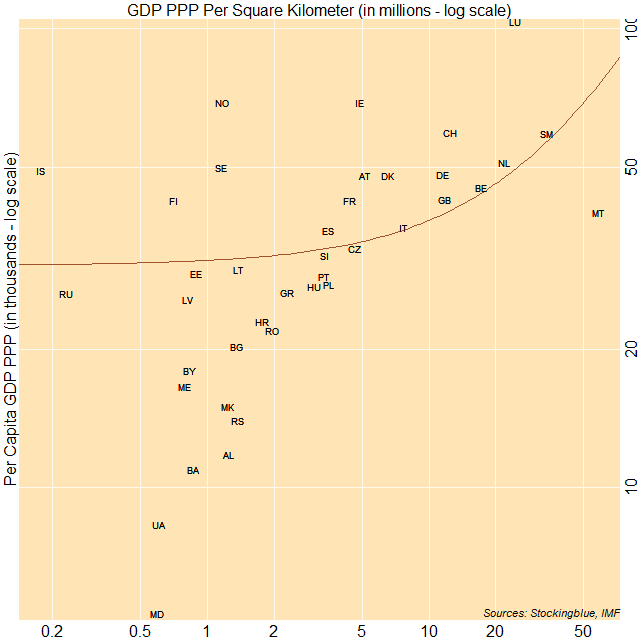
The correlation between per capita gross domestic product based on purchasing power parity (GDP PPP) and GDP PPP per area in Europe is moderate. The three largest economies on a per capita basis have either a low, moderate, or high per area GDP relative to other countries on the continent.
Findings
- The correlation coefficient between per capita Gross Domestic Product (GDP) in Purchasing Power Parity (PPP) and minimum wage in Europe is 0.44.
- As the per capita GDP PPP increases in Europe, the per area GDP PPP somewhat increases.
- Moldova has the lowest per capita GDP PPP and the third lowest per area GDP PPP.
- Iceland has the lowest per area GDP PPP but the eighth highest per capita GDP PPP.
- Luxembourg has the largest per capita GDP PPP and the third highest per area GDP PPP on the continent.
- Malta on the other hand, has the highest per area GDP PPP but the 16th highest per capita GDP PPP.
Caveats
- As always, correlation does not imply causation.
- Andorra, Gibraltar, Guernsey, Vatican City, Isle of Man, Jersey, Liechtenstein, Monaco, and Slovakia were missing data.
Details
Every country that has a per capita GDP PPP of at least 50,000 international dollars, also has a GDP PPP per square kilometer of at least one million international dollars. In addition, every country with a per capita GDP PPP below 20,000 international dollars also has a GDP PPP per square kilometer of at most two million international dollars.
As is usually the case, in Europe, results are geographically clustered. Western European states have both high per capita and per area GDP PPP, Nordic countries have high per capita but low per area GDP PPP, the Blatic states are clustered together as are the Balkan states. Only Southern European states and former Soviet republics are not clustered together.
Country Codes
| Code | Country | GDP PPP Per Square Kilometer | Per Capita GDP PPP |
|---|---|---|---|
| AL | Albania | 1,259,148.46 | 11,840 |
| AT | Austria | 5,155,822.63 | 48,005 |
| BY | Belarus | 835,284.2 | 18,000 |
| BE | Belgium | 17,337,821.02 | 45,047 |
| BA | Bosnia and Herzegovina | 868,449.32 | 10,958 |
| BG | Bulgaria | 1,371,576.22 | 20,327 |
| HR | Croatia | 1,767,077.78 | 22,795 |
| CZ | Czech Republic | 4,674,439.25 | 33,232 |
| DK | Denmark | 6,591,172.79 | 47,985 |
| EE | Estonia | 890,488.19 | 29,313 |
| FI | Finland | 708,755.12 | 42,165 |
| FR | France | 4,400,527.49 | 42,314 |
| DE | Germany | 11,580,989.41 | 48,111 |
| GR | Greece | 2,289,761.06 | 26,669 |
| HU | Hungary | 3,055,703.66 | 27,482 |
| IS | Iceland | 178,014.96 | 49,136 |
| IE | Ireland | 4,890,669.25 | 69,231 |
| IT | Italy | 7,642,939.16 | 36,833 |
| LV | Latvia | 824,722.48 | 25,710 |
| LT | Lithuania | 1,384,180.7 | 29,972 |
| LU | Luxembourg | 24,574,245.94 | 104,003 |
| MK | Macedonia | 1,241,550.97 | 14,597 |
| MT | Malta | 58,240,506.33 | 39,834 |
| MD | Moldova | 596,939.53 | 5,328 |
| ME | Montenegro | 791,630.47 | 16,643 |
| NL | Netherlands | 21,847,699.97 | 51,049 |
| NO | Norway | 1,164,600.59 | 69,249 |
| PL | Poland | 3,563,026.69 | 27,764 |
| PT | Portugal | 3,373,341.3 | 28,933 |
| RO | Romania | 1,972,859.71 | 22,348 |
| RU | Russia | 230,316.13 | 26,490 |
| SM | San Marino | 34,311,475.41 | 59,058 |
| RS | Serbia | 1,382,799.39 | 14,493 |
| SI | Slovenia | 3,421,200.61 | 32,085 |
| ES | Spain | 3,500,041.55 | 36,416 |
| SE | Sweden | 1,161,125.48 | 49,836 |
| CH | Switzerland | 12,456,380.07 | 59,561 |
| UA | Ukraine | 609,803.66 | 8,305 |
| GB | United Kingdom | 11,926,406.96 | 42,481 |