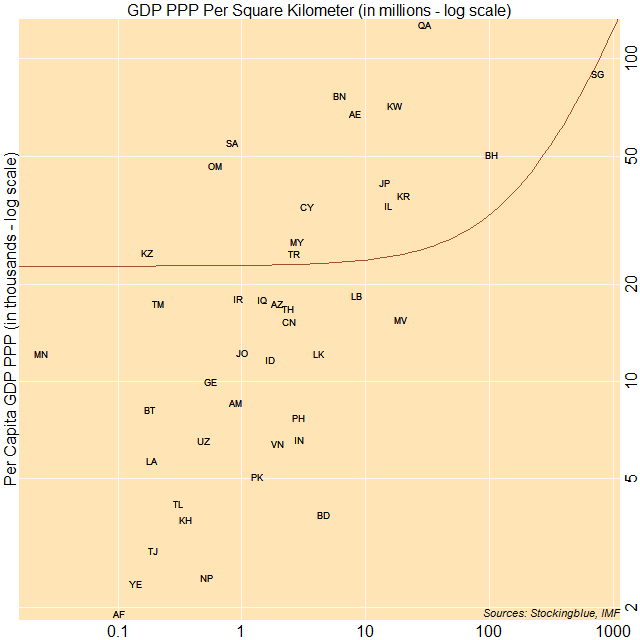
The correlation between per capita gross domestic product based on purchasing power parity (GDP PPP) and GDP PPP per area in Asia is moderate. The three largest economies on a per capita basis have either a moderate or high per area GDP relative to other countries on the continent.
Findings
- The correlation coefficient between per capita Gross Domestic Product (GDP) in Purchasing Power Parity (PPP) and minimum wage in Asia is 0.42.
- As the per capita GDP PPP increases in Asia, the per area GDP PPP somewhat increases.
- Afghanistan has the lowest per capita GDP PPP and the second lowest per area GDP PPP.
- Mongolia has the lowest per area GDP PPP but the 19th lowest per capita GDP PPP.
- Qatar has the largest per capita GDP PPP and the third highest per area GDP PPP on the continent.
- Singapore on the other hand, has the highest per area GDP PPP and the second highest per capita GDP PPP.
Caveats
- As always, correlation does not imply causation.
- The British Indian Ocean Territory, Christmas Island, Cocos (Keeling) Islands, Hong Kong, North Korea, Kyrgyzstan, Macao, Myanmar, Palestine, Syria, and Taiwan were missing data.
Details
Every country that has a per capita GDP PPP of at least 50,000 international dollars save for Saudi Arabia, also has a GDP PPP per square kilometer of at least six million international dollars. In addition, every country with a per capita GDP PPP below 5,000 international dollars save for Bangladesh, also has a GDP PPP per square kilometer of at most 600,000 international dollars.
Unlike Europe, there are no geographic clusters.
Country Codes
| Code | Country | GDP PPP Per Square Kilometer | Per Capita GDP PPP |
|---|---|---|---|
| AF | Afghanistan | 103,432.84 | 1,919 |
| AM | Armenia | 911,676.7 | 8,621 |
| AZ | Azerbaijan | 1,933,383.37 | 17,439 |
| BH | Bahrain | 105,145,864.66 | 50,704 |
| BD | Bangladesh | 4,624,801.29 | 3,891 |
| BT | Bhutan | 183,492.21 | 8,227 |
| BN | Brunei | 6,231,119.54 | 76,884 |
| KH | Cambodia | 355,759.94 | 3,737 |
| CN | China | 2,416,849.81 | 15,399 |
| CY | Cyprus | 3,361,042.05 | 34,970 |
| GE | Georgia | 564,103.3 | 10,044 |
| IN | India | 2,886,687.8 | 6,616 |
| ID | Indonesia | 1,710,162.77 | 11,720 |
| IR | Iran | 931,619.74 | 18,077 |
| IQ | Iraq | 1,462,423.31 | 17,944 |
| IL | Israel | 15,220,028.89 | 35,179 |
| JP | Japan | 14,342,452.67 | 41,275 |
| JO | Jordan | 1,002,384.1 | 12,278 |
| KZ | Kazakhstan | 173,423.98 | 25,145 |
| KW | Kuwait | 17,377,932.43 | 71,887 |
| LA | Laos | 188,509.29 | 5,710 |
| LB | Lebanon | 8,537,115.38 | 18,525 |
| MY | Malaysia | 2,795,408.17 | 27,267 |
| MV | Maldives | 19,510,000 | 15,553 |
| MN | Mongolia | 24,122.89 | 12,275 |
| NP | Nepal | 524,164.12 | 2,479 |
| OM | Oman | 612,542.81 | 46,698 |
| PK | Pakistan | 1,332,214.12 | 5,106 |
| PH | Philippines | 2,929,933.33 | 7,728 |
| QA | Qatar | 30,026,497.5 | 127,660 |
| SA | Saudi Arabia | 835,564.66 | 55,158 |
| SG | Singapore | 753,787,701.32 | 90,151 |
| KR | South Korea | 20,354,051.34 | 37,740 |
| LK | Sri Lanka | 4,243,484.22 | 12,262 |
| TJ | Tajikistan | 192,935.46 | 3,008 |
| TH | Thailand | 2,390,097.83 | 16,888 |
| TL | Timor-Leste | 307,045.85 | 4,187 |
| TR | Turkey | 2,657,197.52 | 24,912 |
| TM | Turkmenistan | 213,044.46 | 17,485 |
| AE | United Arab Emirates | 8,298,624.4 | 67,871 |
| UZ | Uzbekistan | 497,970.5 | 6,563 |
| VN | Vietnam | 1,957,196.34 | 6,429 |
| YE | Yemen | 140,633.52 | 2,375 |