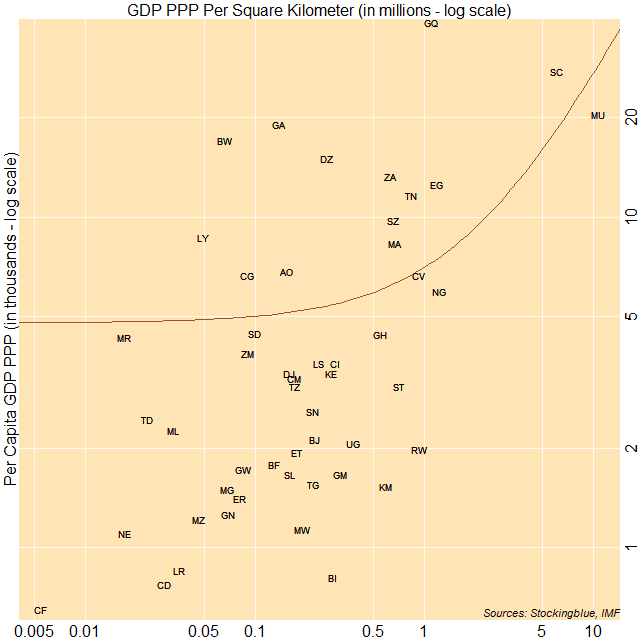
The correlation between per capita gross domestic product based on purchasing power parity (GDP PPP) and GDP PPP per area in Africa is moderate. The three largest economies on a per capita basis all have a high per area GDP relative to other countries on the continent.
Findings
- The correlation coefficient between per capita Gross Domestic Product (GDP) in Purchasing Power Parity (PPP) and minimum wage in Africa is 0.50.
- As the per capita GDP PPP increases in Africa, the per area GDP PPP somewhat increases.
- The Central African Republic has the lowest per capita GDP PPP and the lowest per area GDP PPP.
- Equatorial Guinea has the largest per capita GDP PPP and the fifth highest per area GDP PPP on the continent.
- Mauritius on the other hand, has the highest per area GDP PPP and the third highest per capita GDP PPP.
Caveats
- As always, correlation does not imply causation.
- Mayotte, Reunion, Somalia, South Sudan, Western Sahara, and Zimbabwe were missing data.
Details
Every country that has a per capita GDP PPP of at least 20,000 international dollars, also has a GDP PPP per square kilometer of at least one million international dollars. In addition, every country with a per capita GDP PPP below 1,000 international dollars, also has a GDP PPP per square kilometer of at most 50,000 international dollars.
Just like in Asia, there are no geographic clusters.
Country Codes
| Code | Country | GDP PPP Per Square Kilometer | Per Capita GDP PPP |
|---|---|---|---|
| DZ | Algeria | 266,505.05 | 15,026 |
| AO | Angola | 155,558.67 | 6,844 |
| BJ | Benin | 225,595.35 | 2,119 |
| BW | Botswana | 67,134.24 | 17,042 |
| BF | Burkina Faso | 129,824.95 | 1,782 |
| BI | Burundi | 288,321.95 | 814 |
| CM | Cameroon | 171,493.77 | 3,249 |
| CV | Cape Verde | 932,804.36 | 6,662 |
| CF | Central African Republic | 5,475.26 | 652 |
| TD | Chad | 23,154.21 | 2,445 |
| KM | Comoros | 594,630.87 | 1,529 |
| CG | Congo | 89,494.15 | 6,676 |
| CI | Cote d'Ivoire | 297,358.15 | 3,609 |
| CD | Democratic Republic of the Congo | 29,140.78 | 773 |
| DJ | Djibouti | 159,181.9 | 3,370 |
| EG | Egypt | 1,196,232.46 | 12,554 |
| GQ | Equatorial Guinea | 1,098,249.62 | 38,639 |
| ER | Eritrea | 82,295.92 | 1,410 |
| ET | Ethiopia | 176,564.34 | 1,946 |
| GA | Gabon | 138,227.72 | 19,056 |
| GM | Gambia | 319,203.54 | 1,667 |
| GH | Ghana | 551,231.8 | 4,412 |
| GN | Guinea | 69,373.66 | 1,265 |
| GW | Guinea-Bissau | 85,508.65 | 1,730 |
| KE | Kenya | 283,165.65 | 3,361 |
| LS | Lesotho | 240,059.3 | 3,601 |
| LR | Liberia | 35,557.47 | 855 |
| LY | Libya | 49,482.82 | 8,678 |
| MG | Madagascar | 68,232.03 | 1,505 |
| MW | Malawi | 190,548.93 | 1,134 |
| ML | Mali | 33,038.43 | 2,266 |
| MR | Mauritania | 16,902.11 | 4,328 |
| MU | Mauritius | 10,636,890.95 | 20,422 |
| MA | Morocco | 673,062.37 | 8,330 |
| MZ | Mozambique | 46,687.43 | 1,215 |
| NA | Namibia | 33,302.52 | 11,290 |
| NE | Niger | 17,091.55 | 1,107 |
| NG | Nigeria | 1,217,434.46 | 5,942 |
| RW | Rwanda | 938,453.94 | 1,977 |
| ST | Sao Tome and Principe | 710,580.91 | 3,072 |
| SN | Senegal | 220,239.73 | 2,577 |
| SC | Seychelles | 6,068,131.87 | 27,602 |
| SL | Sierra Leone | 161,011.99 | 1,672 |
| ZA | South Africa | 624,995.69 | 13,225 |
| SD | Sudan | 100,304.38 | 4,447 |
| SZ | Swaziland | 653,766.41 | 9,776 |
| TZ | Tanzania | 172,619.02 | 3,080 |
| TG | Togo | 220,022.89 | 1,550 |
| TN | Tunisia | 836,116.37 | 11,634 |
| UG | Uganda | 378,413.36 | 2,068 |
| ZM | Zambia | 91,212.28 | 3,880 |