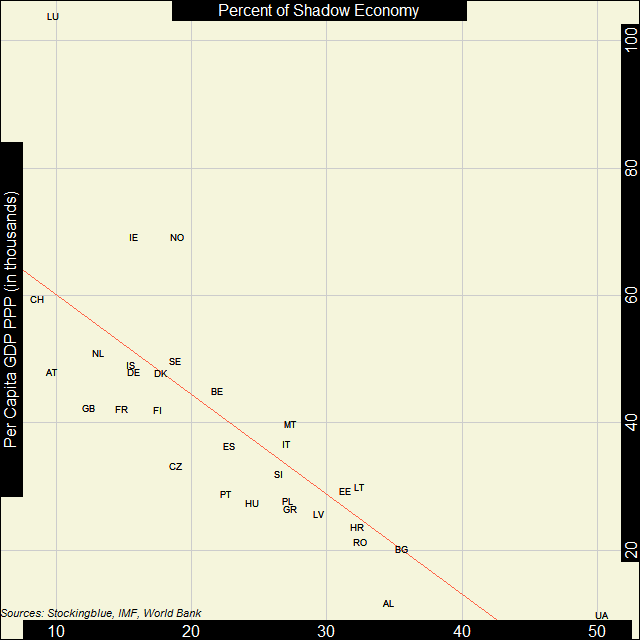
In Europe, the correlation between economic strength and the strength of the shadow economy is pretty strong. Every country studied on the continent - excluding Albania, Bulgaria, and Ukraine - has a shadow economy that takes up at most one-third of its overall economy.
Findings
- The correlation coefficient between per capita Gross Domestic Product (GDP) in Purchasing Power Parity (PPP) and shadow economies in Europe is -0.78.
- As economic strength increases in Europe, the shadow economy decreases.
- Unlike in North and South America, the country with the smallest shadow economy (Switzerland) does not have the largest per capita GDP PPP of the European nations studied by the Global Foundation for Integrity (GFI).
- Luxembourg has the largest per capita GDP PPP, yet it only has the third smallest shadow activity as a percentage of its overall economy.
- Ukraine had the largest shadow economy of the European nations studied by GFI, as well as the smallest per capita GDP PPP.
- It is also the only European country whose shadow economy takes up over half of the economy as a whole.
Caveats
- As always, correlation does not imply causation.
- Andorra, Bosnia and Herzegovina, Liechtenstein, the Former Yugoslav Republic of Macedonia, Moldova, Monaco, Montenegro, Russia, San Marino, Serbia, Slovakia, and the Vatican City were missing data.
- The GDP data is from 2016 while the shadow economy data is the average from 1999-2006.
Details
With the exception of Luxembourg and Ukraine which are the only two outliers in the group, the remaining European nations cluster around each other in geographic blocs. Nordic and Western European countries all have a per capita GDP PPP between 40,000 and 60,000 international dollars while also limiting their shadow economies to under one-fifth of their overall economic activity. Ireland and Norway are nearby with a larger per capita GDP PPP.
Then there is Southern Europe and parts of Eastern Europe whose per capita GDP PPP ranges between 20,000 and 40,000 international dollars and whose shadow economies take up between 20 and 30 percent of their overall economies. Finally, Baltic and Balkan countries manage to maintain the same per capita GDP PPP as their neighbors but have shadow economies that take up between 30 and 40 percent of their overall economies.
All countries in South America, except for Chile, have shadow economies that take up over one-quarter of the overall economy, and all except for Chile and Argentina have shadow economies that take up at least one-third of their overall economy. Uruguay and Peru have less than half of their economic activity in legitimate transactions.
Country Codes
| Code | Country |
|---|---|
| AL | Albania |
| AT | Austria |
| BE | Belgium |
| BG | Bulgaria |
| CH | Switzerland |
| CZ | Czech Republic |
| DE | Germany |
| DK | Denmark |
| EE | Estonia |
| ES | Spain |
| FI | Finland |
| FR | France |
| GB | United Kingdom |
| GR | Greece |
| HR | Croatia |
| HU | Hungary |
| IE | Ireland |
| IS | Iceland |
| IT | Italy |
| LT | Lithuania |
| LU | Luxembourg |
| LV | Latvia |
| MT | Malta |
| NL | Netherlands |
| NO | Norway |
| PL | Poland |
| PT | Portugal |
| RO | Romania |
| SE | Sweden |
| SI | Slovenia |
| UA | Ukraine |
Sources
Schneider, Friedrich, Andreas Buehn, and Claudio E. Montenegro. 2010. "Shadow Economies All over the World: New Estimates for 162 Countries from 1999 to 2007." The World Bank Development Research Group.