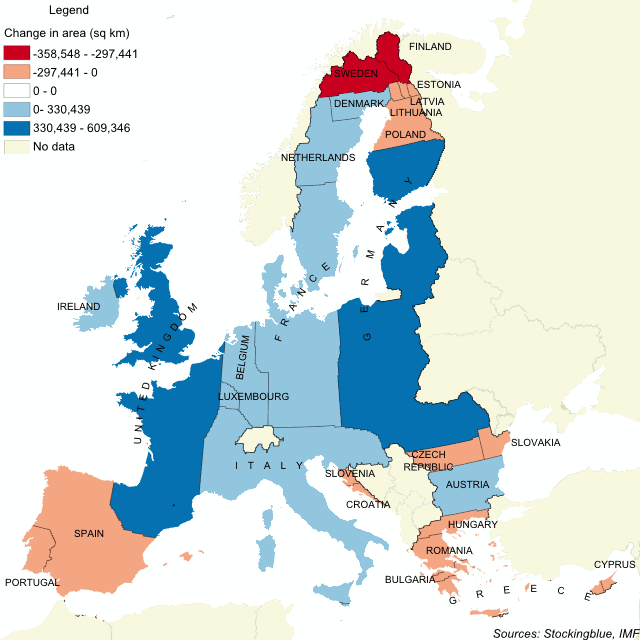
This geographically accurate cartogram represents how the EU's borders would have been had they been drawn up according to each country's GDP. The United Kingdom, France, Germany, and Italy take up large swaths of the Union leaving the remaining states crunched up against each other.
Findings
- Malta gains the most territory percentage-wise as it grows by 1,252%! That does not prevent it from remaining the smallest state in the Union.
- Germany becomes the largest state in the Union as well as having the largest growth in area.
- Latvia shrinks the most percentage-wise: 92%.
- However, it is Sweden that cedes the most land losing over 350,000 square kilometers of area.
Caveats
- The GDP data is from 2016.
Details
Several countries grow to more than twice their size including Malta, Luxembourg, Netherlands, Belgium, United Kingdom, Germany, and Italy.
A whole slew of countries wind up ceding more than half of their territory. These include: Latvia, Estonia, Finland, Lithuania, Bulgaria, Sweden, Romania, Poland, Croatia, and Hungary.
The United Kingdom expands all the way down to northeast Spain meaning that all those Brits heading down south would still be in the same country. Spain on the other hand, loses Catalonia.
Italy expands in three directions and overtakes southern France, parts of Austria, and the northern Balkans leaving Slovenia and Croatia to be a sliver of their former selves.
France, the Netherlands, and Denmark take up the majority of Sweden leaving only the northern territories to the Swedes, while Germany overtakes eastern Europe forcing Poland and the Baltic states deep into Finland which, like Sweden, only gets to hold on to its northernmost region.
Greece winds up on the southern Peloponnese, some Aegean islands, Crete, and part of western Cyprus. Bulgaria takes up a sliver of the Peloponnese while Romania takes up the majority of the Greek mainland leaving Hungary with the northern part of the country.
Austria takes up what used to be Bulgaria and parts of Romania, while the Czech Republic and Slovakia take up the rest of Romania.
Data
| State | GDP (in millions) | Existing Area (sq km) | Projected Area (based on GDP) | Percent Change in Area |
|---|---|---|---|---|
| Germany | 3,144,050 | 357,804 | 967,150 | 170 |
| United Kingdom | 2,393,133.5 | 245,771 | 815,914 | 232 |
| France | 2,228,857 | 549,266 | 679,647 | 24 |
| Italy | 1,680,522.8 | 301,167 | 631,606 | 110 |
| Spain | 1,118,522 | 506,330 | 448,015 | -12 |
| Netherlands | 702,641 | 35,249 | 162,495 | 361 |
| Belgium | 423,048.4 | 30,654 | 140,718 | 359 |
| Austria | 353,296.9 | 83,941 | 135,581 | 62 |
| Poland | 425,980.2 | 312,014 | 97,061 | -69 |
| Sweden | 465,200.6 | 451,284 | 92,736 | -79 |
| Ireland | 275,567.1 | 70,258 | 86,687 | 23 |
| Portugal | 185,179.5 | 92,112 | 77,695 | -16 |
| Greece | 174,199.3 | 132,963 | 73,823 | -44 |
| Romania | 169,578.1 | 237,768 | 68,951 | -71 |
| Czech Republic | 176,564.3 | 78,892 | 65,335 | -17 |
| Denmark | 277,339.4 | 45,086 | 59,089 | 31 |
| Hungary | 113,730.8 | 93,026 | 44,902 | -52 |
| Finland | 215,615 | 339,027 | 41,586 | -88 |
| Slovakia | 81,154 | 49,031 | 29,779 | -39 |
| Bulgaria | 48,128.6 | 110,972 | 19,682 | -82 |
| Luxembourg | 53,004.8 | 2,596 | 18,407 | 609 |
| Croatia | 46,284.9 | 56,863 | 17,585 | -69 |
| Slovenia | 40,418.1 | 20,279 | 15,044 | -26 |
| Lithuania | 38,668.3 | 64,921 | 8,161 | -87 |
| Cyprus | 18,122.5 | 9,060 | 7,681 | -15 |
| Latvia | 24,926.7 | 64,609 | 5,330 | -92 |
| Estonia | 21,098.3 | 45,452 | 4,410 | -90 |
| Malta | 9,943.1 | 324 | 4,381 | 1,252 |