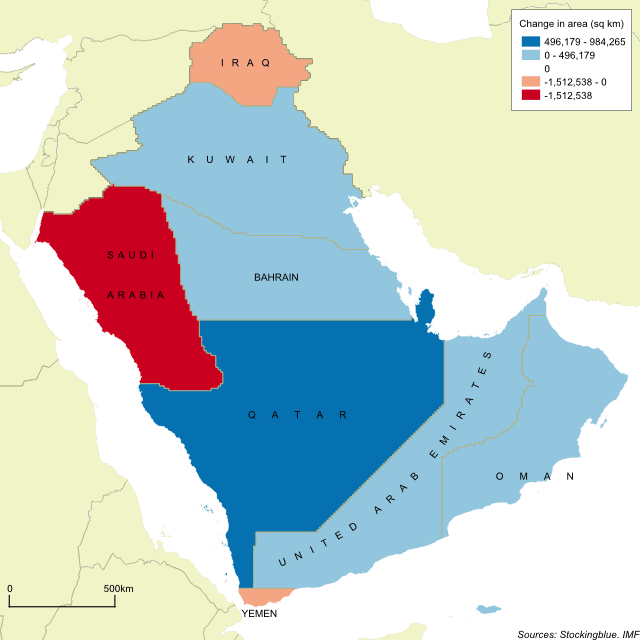
The geographically accurate cartogram above represents the borders of the nations in the region based on their per capita GDP. Qatar becomes the largest state in the region by far and is nearly double the size of the second largest state.
Findings
- Bahrain gains the most territory in both absolute and relative terms as it grows by 55,183%.
- Saudi Arabia cedes the most territory.
- Iraq gains the most territory and becomes the largest state in the region.
- Yemen loses the most land percentage-wise.
Caveats
- The borders represent the area of the country if it were based on per capita GDP. The location of the states on the map is irrelevant.
Details
Several countries grow to more than twice their size including (in descending order of growth) Bahrain, Qatar, Kuwait, and the UAE.
The only countries to give up more than half of their territory are Iraq, Saudi Arabia, and Yemen.
Data
| State | Per Capita GDP | Existing Area (sq km) | Projected Area (based on per capita GDP) | Percent Change in Area |
|---|
| Qatar | 127,660 | 11,545 | 995,810 | 8,525 |
| Kuwait | 71,887 | 17,365 | 535,791 | 2,985 |
| United Arab Emirates | 67,871 | 70,753 | 513,544 | 626 |
| Saudi Arabia | 55,158 | 1,925,523 | 412,985 | -79 |
| Bahrain | 50,704 | 685 | 378,690 | 55,183 |
| Oman | 46,698 | 308,946 | 365,683 | 18 |
| Iraq | 17,944 | 436,994 | 122,113 | -72 |
| Yemen | 2,375 | 453,501 | 19,320 | -96 |
Sources
"Report for Selected Country Groups and Subjects (PPP Valuation of Country GDP)." http://www.imf.org/external/pubs/ft/weo/2017/01/weodata/weorept.aspx?pr.x=43&pr.y=5&sy=2016&ey=2016&ssd=1&sort=country&ds=.&br=1&c=512%2C672%2C914%2C946%2C612%2C137%2C614%2C546%2C311%2C962%2C213%2C674%2C911%2C676%2C193%2C548%2C122%2C556%2C912%2C678%2C313%2C181%2C419%2C867%2C513%2C682%2C316%2C684%2C913%2C273%2C124%2C868%2C339%2C921%2C638%2C948%2C514%2C943%2C218%2C686%2C963%2C688%2C616%2C518%2C223%2C728%2C516%2C836%2C918%2C558%2C748%2C138%2C618%2C196%2C624%2C278%2C522%2C692%2C622%2C694%2C156%2C142%2C626%2C449%2C628%2C564%2C228%2C565%2C924%2C283%2C233%2C853%2C632%2C288%2C636%2C293%2C634%2C566%2C238%2C964%2C662%2C182%2C960%2C359%2C423%2C453%2C935%2C968%2C128%2C922%2C611%2C714%2C321%2C862%2C243%2C135%2C248%2C716%2C469%2C456%2C253%2C722%2C642%2C942%2C643%2C718%2C939%2C724%2C644%2C576%2C819%2C936%2C172%2C961%2C132%2C813%2C646%2C199%2C648%2C733%2C915%2C184%2C134%2C524%2C652%2C361%2C174%2C362%2C328%2C364%2C258%2C732%2C656%2C366%2C654%2C734%2C336%2C144%2C263%2C146%2C268%2C463%2C532%2C528%2C944%2C923%2C176%2C738%2C534%2C578%2C536%2C537%2C429%2C742%2C433%2C866%2C178%2C369%2C436%2C744%2C136%2C186%2C343%2C925%2C158%2C869%2C439%2C746%2C916%2C926%2C664%2C466%2C826%2C112%2C542%2C111%2C967%2C298%2C443%2C927%2C917%2C846%2C544%2C299%2C941%2C582%2C446%2C474%2C666%2C754%2C668%2C698&s=PPPPC&grp=0&a=. International Monetary Fund.
