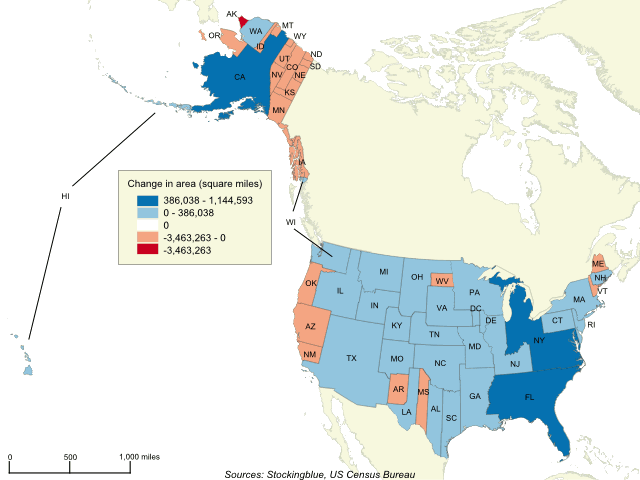
The geographically accurate cartogram above represents the borders of the states in the US based on their population. California becomes the largest state by far while Massachusetts, New York and Florida dominate the east coast. Texas takes over the Southwest while Alaska loses the most territory.
Findings
- California gains the most territory by far.
- Alaska cedes the most territory in both absolute and relative terms.
- Washington DC gains the most territory percentage-wise growing by 12,509 percent!
- Excluding Washington DC, New Jersey grows the most percentage wise at 1,334 percent.
Caveats
- The borders represent the area of the state if it were based on population. The location of the states on the map is irrelevant.
Details
Several states grow to more than twice their size including (in descending order of growth) New Jersey, Rhode Island, Massachusetts, Connecticut, Maryland, Delaware, Florida, New York, Ohio, Pennsylvania, Hawaii, California, Illinois, North Carolina, Virginia, Georgia, Indiana, South Carolina, and Tennessee.
The states that cede more than half of their territory include (in descending order of growth) Oregon, Maine, Utah, Kansas, Nevada, Nebraska, New Mexico, Idaho, South Dakota, North Dakota, Montana, Wyoming, and Alaska.
Data
| State | Population | Existing Area (square miles) | Projected Area (based on population) | Percent Change in Area |
|---|---|---|---|---|
| Alabama | 4,863,300 | 159,756 | 205,037 | 28 |
| Alaska | 741,894 | 3,494,728 | 31,465 | -99 |
| Arizona | 6,931,071 | 358,367 | 292,469 | -18 |
| Arkansas | 2,988,248 | 168,351 | 125,786 | -25 |
| California | 39,268,294 | 516,352 | 1,660,945 | 222 |
| Colorado | 5,540,545 | 347,462 | 233,743 | -33 |
| Connecticut | 3,576,452 | 17,311 | 151,717 | 776 |
| Delaware | 952,065 | 6,711 | 39,705 | 492 |
| District of Columbia | 681,170 | 228 | 28,749 | 12,509 |
| Florida | 20,612,439 | 172,681 | 872,138 | 405 |
| Georgia | 10,310,371 | 181,772 | 436,082 | 140 |
| Hawaii | 1,428,557 | 17,947 | 60,035 | 235 |
| Idaho | 1,683,140 | 303,070 | 71,077 | -77 |
| Illinois | 12,801,539 | 190,941 | 541,372 | 184 |
| Indiana | 6,633,053 | 122,349 | 280,265 | 129 |
| Iowa | 3,134,693 | 196,503 | 132,954 | -32 |
| Kansas | 2,907,289 | 272,678 | 123,065 | -55 |
| Kentucky | 4,436,974 | 132,204 | 187,238 | 42 |
| Louisiana | 4,681,666 | 143,056 | 198,250 | 39 |
| Maine | 1,331,479 | 120,862 | 56,111 | -54 |
| Maryland | 6,016,447 | 34,354 | 254,277 | 640 |
| Massachusetts | 6,811,779 | 28,731 | 288,345 | 904 |
| Michigan | 9,928,300 | 211,349 | 419,694 | 99 |
| Minnesota | 5,519,952 | 316,470 | 233,762 | -26 |
| Mississippi | 2,988,726 | 147,284 | 125,787 | -15 |
| Missouri | 6,093,000 | 230,683 | 258,373 | 12 |
| Montana | 1,042,520 | 558,614 | 43,781 | -92 |
| Nebraska | 1,907,116 | 267,846 | 80,572 | -70 |
| Nevada | 2,940,058 | 371,012 | 124,416 | -66 |
| New Hampshire | 1,334,795 | 33,255 | 56,107 | 69 |
| New Jersey | 8,944,469 | 26,405 | 378,694 | 1,334 |
| New Mexico | 2,081,015 | 382,825 | 87,492 | -77 |
| New York | 19,745,289 | 173,574 | 835,244 | 381 |
| North Carolina | 10,146,788 | 158,397 | 429,211 | 171 |
| North Dakota | 757,952 | 270,639 | 31,383 | -88 |
| Ohio | 11,614,373 | 140,276 | 490,816 | 250 |
| Oklahoma | 3,923,561 | 223,118 | 165,403 | -26 |
| Oregon | 4,093,465 | 349,188 | 173,682 | -50 |
| Pennsylvania | 12,784,227 | 155,346 | 541,384 | 249 |
| Rhode Island | 1,056,426 | 3,814 | 45,098 | 1,082 |
| South Carolina | 4,961,119 | 97,356 | 210,484 | 116 |
| South Dakota | 865,454 | 279,790 | 36,881 | -87 |
| Tennessee | 6,651,194 | 134,940 | 281,584 | 109 |
| Texas | 27,862,596 | 809,540 | 1,179,318 | 46 |
| Utah | 3,051,217 | 284,705 | 128,534 | -55 |
| Vermont | 624,594 | 34,672 | 25,979 | -25 |
| Virginia | 8,411,808 | 132,418 | 355,354 | 168 |
| Washington | 7,288,000 | 258,988 | 308,983 | 19 |
| West Virginia | 1,831,102 | 80,471 | 77,977 | -3 |
| Wisconsin | 5,778,708 | 204,348 | 244,562 | 20 |
| Wyoming | 585,501 | 346,628 | 24,587 | -93 |
Sources
United States Census Bureau. "Annual Estimates of the Resident Population: April 1, 2010 to July 1, 2016." Accessed November 8, 2017. http://factfinder2.census.gov.