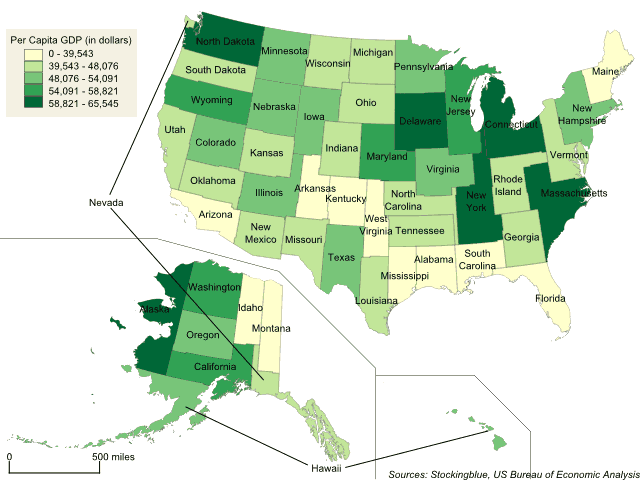
The geographically accurate cartogram above represents the states' boundaries based on per capita GDP. In this metric, all 50 states have similar areas as there is not much fluctuation from state to state.
Findings
- Rhode Island gains the most territory percentage-wise as it grows by 4,725 percent.
- Delaware gains the most land.
- Alaska shrinks the most in both relative and absolute terms losing 93 percent of its territory.
- Mississippi becomes the smallest state in the Union while Massachusetts becomes the largest state in the Union.
Caveats
- The GDP data is from 2016.
- The borders represent the area of the state if it were based on GDP. The location of the states on the map is irrelevant.
Details
Several states grow to more than twice their size including (in descending order of growth) Rhode Island, Delaware, Connecticut, Hawaii, Massachusetts, New Jersey, Maryland, New Hampshire, and Vermont.
The states that cede more than half of their territory are (in descending order of growth) Nevada, Idaho, California, New Mexico, Arizona, Montana, Texas, and Alaska.
The map shows that intrastate inequality is quite small when measured by the per capita GDP metric which is quite impressive considering how certain major industries are concentrated in a few key states.
Data
| State | Per Capita GDP | Existing Area (sq km) | Projected Area (based on per capita GDP) | Percent Change in Area |
|---|---|---|---|---|
| Massachusetts | 65,545 | 28,731 | 253,259 | 781 |
| New York | 64,579 | 173,574 | 249,474 | 44 |
| Connecticut | 64,511 | 17,311 | 249,465 | 1,341 |
| Alaska | 63,971 | 3,494,728 | 246,690 | -93 |
| Delaware | 63,664 | 6,711 | 245,750 | 3,562 |
| North Dakota | 62,837 | 270,639 | 242,978 | -10 |
| Wyoming | 58,821 | 346,628 | 227,028 | -34 |
| California | 58,619 | 516,352 | 226,124 | -56 |
| New Jersey | 57,084 | 26,405 | 220,545 | 735 |
| Washington | 56,831 | 258,988 | 219,598 | -15 |
| Maryland | 55,404 | 34,354 | 213,947 | 523 |
| Illinois | 54,091 | 190,941 | 209,319 | 10 |
| Minnesota | 53,704 | 316,470 | 207,442 | -34 |
| Texas | 53,795 | 809,540 | 207,409 | -74 |
| Nebraska | 53,114 | 267,846 | 204,649 | -24 |
| Colorado | 52,795 | 347,462 | 201,714 | -42 |
| Virginia | 51,736 | 132,418 | 199,995 | 51 |
| New Hampshire | 51,794 | 33,255 | 199,970 | 501 |
| Hawaii | 51,277 | 17,947 | 198,084 | 1,004 |
| Pennsylvania | 50,997 | 155,346 | 197,206 | 27 |
| Oregon | 50,582 | 349,188 | 195,301 | -44 |
| Iowa | 50,315 | 196,503 | 194,366 | -1 |
| South Dakota | 48,076 | 279,790 | 185,937 | -34 |
| Ohio | 47,567 | 140,276 | 184,067 | 31 |
| Rhode Island | 47,639 | 3,814 | 184,029 | 4,725 |
| Wisconsin | 47,266 | 204,348 | 182,187 | -11 |
| Kansas | 46,982 | 272,678 | 181,313 | -34 |
| Indiana | 45,317 | 122,349 | 174,740 | 43 |
| Georgia | 44,723 | 181,772 | 172,816 | -5 |
| Oklahoma | 44,623 | 223,118 | 171,926 | -23 |
| Utah | 44,636 | 284,705 | 171,918 | -40 |
| North Carolina | 44,325 | 158,397 | 170,981 | 8 |
| Vermont | 43,946 | 34,672 | 170,051 | 390 |
| Nevada | 43,820 | 371,012 | 169,149 | -54 |
| Louisiana | 43,917 | 143,056 | 169,133 | 18 |
| Michigan | 43,372 | 211,349 | 167,263 | -21 |
| Missouri | 43,317 | 230,683 | 167,260 | -27 |
| Tennessee | 43,267 | 134,940 | 167,211 | 24 |
| New Mexico | 41,348 | 382,825 | 159,764 | -58 |
| Florida | 39,543 | 172,681 | 152,361 | -12 |
| Montana | 39,356 | 558,614 | 152,348 | -73 |
| Maine | 38,921 | 120,862 | 150,467 | 24 |
| Kentucky | 38,985 | 132,204 | 150,413 | 14 |
| Arizona | 38,590 | 358,367 | 148,547 | -59 |
| Alabama | 37,261 | 159,756 | 143,912 | -10 |
| South Carolina | 37,063 | 97,356 | 143,009 | 47 |
| West Virginia | 36,315 | 80,471 | 140,130 | 74 |
| Arkansas | 36,368 | 168,351 | 140,122 | -17 |
| Idaho | 35,466 | 303,070 | 137,409 | -55 |
| Mississippi | 31,881 | 147,284 | 123,317 | -16 |
Sources
US Bureau of Economic Analysis. 2017. "Regional Data." Accessed October 26, 2017. https://bea.gov/itable/iTable.cfm?ReqID=70&step=1#reqid=70&step=1&isuri=1.