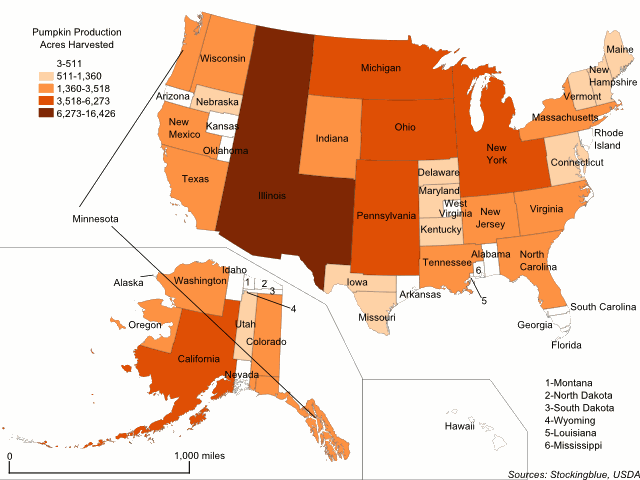
This week, the focus is on common Thanksgiving foods and which states produce them. The geographically accurate cartogram above redraws the states' sizes based on pumpkin production. Specifically the number of acres dedicated to the pumpkin harvest. Every state produces pumpkins, but some dedicate so few acres to the crop that they barely show up on the map, namely Alaska, Wyoming, and Louisiana.
Findings
- Illinois is responsible for one-fifth of the nation's total pumpkin harvesting acreage.
- Alaska only dedicates three acres to harvesting pumpkins, compared to Illinois' 16,426.
- Whereas Illinois makes up 18 percent of the total acreage devoted to pumpkins nationwide, the second leading state, New York, makes up just under seven percent.
- The Northeast and the Industrial Midwest account for just over 55 percent of the nation's total acreage dedicated to pumpkin production.
Caveats
- The agriculture census data is from 2012.
Details
California is the only major producer west of the Mississippi.
As the map above portrays the States' borders as they would have been delineated based on the number of acres dedicated to the pumpkin harvest, it is safe to say that pumpkins are a crop that is more commonly grown in eastern states and barely bothered with in the Great Plains. In the South, only Texas, North Carolina, Tennessee, and Virginia dedicate a significant amount of acreage to the crop.
Data
| State | Acres Devoted to Pumpkin Production | Percent of Total |
|---|---|---|
| Illinois | 16,426 | 18.22 |
| New York | 6,273 | 6.96 |
| Pennsylvania | 6,188 | 6.86 |
| California | 6,175 | 6.85 |
| Michigan | 5,997 | 6.65 |
| Ohio | 4,452 | 4.94 |
| Indiana | 3,518 | 3.9 |
| Texas | 2,860 | 3.17 |
| Wisconsin | 2,736 | 3.03 |
| North Carolina | 2,514 | 2.79 |
| Minnesota | 2,374 | 2.63 |
| Washington | 2,314 | 2.57 |
| Virginia | 2,310 | 2.56 |
| Oregon | 2,189 | 2.43 |
| New Jersey | 2,130 | 2.36 |
| Tennessee | 2,081 | 2.31 |
| New Mexico | 1,879 | 2.08 |
| Massachusetts | 1,854 | 2.06 |
| Colorado | 1,824 | 2.02 |
| Connecticut | 1,360 | 1.51 |
| Iowa | 1,175 | 1.3 |
| Missouri | 1,043 | 1.16 |
| Kentucky | 1,010 | 1.12 |
| Utah | 922 | 1.02 |
| Maryland | 874 | 0.97 |
| Nebraska | 845 | 0.94 |
| Delaware | 793 | 0.88 |
| Maine | 642 | 0.71 |
| Vermont | 620 | 0.69 |
| New Hampshire | 607 | 0.67 |
| Kansas | 511 | 0.57 |
| Arkansas | 426 | 0.47 |
| Alabama | 407 | 0.45 |
| Idaho | 362 | 0.4 |
| Arizona | 334 | 0.37 |
| Nevada | 285 | 0.32 |
| Oklahoma | 243 | 0.27 |
| West Virginia | 230 | 0.26 |
| Hawaii | 219 | 0.24 |
| Georgia | 199 | 0.22 |
| North Dakota | 187 | 0.21 |
| Rhode Island | 165 | 0.18 |
| South Carolina | 153 | 0.17 |
| South Dakota | 143 | 0.16 |
| Mississippi | 135 | 0.15 |
| Montana | 119 | 0.13 |
| Florida | 43 | 0.05 |
| Louisiana | 13 | 0.01 |
| Wyoming | 4 | 0 |
| Alaska | 3 | 0 |
Sources
United States Department of Agriculture. 2017. "USDA/NASS QuickStats Ad-Hoc Query Tool." Accessed November 19, 2017. https://quickstats.nass.usda.gov/?source_desc=CENSUS.