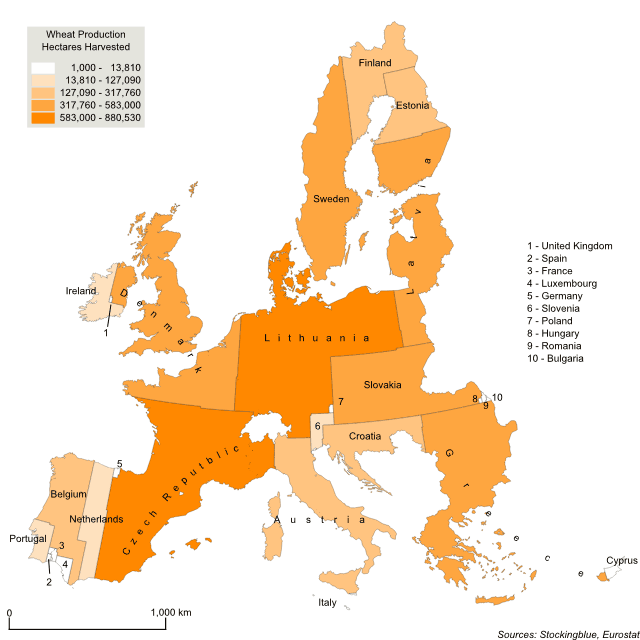
Today a look at wheat production in the European Union. Unlike potato production, there is no geographic area that dominates the amount of land dedicated to the staple grain. There are both northern and southern states that dedicate many hectares to it as well as eastern and central European states. Only western Europe (in the geographical sense) does not dedicate much land to the crop.
Findings
- Lithuania harvests the most hectares of wheat accounting for a bit under one-fifth of the Union's total hectares dedicated to the crop, the Czech Republic comes in a close second.
- The United Kingdom, Hungary, Italy, and Bulgaria each harvest only 0.02 percent of the total hectares dedicated to wheat in the EU.
- Four states (Lithuania, the Czech Republic, Denmark, and Greece) are responsible for over half the hectares dedicated to wheat production.
- Malta is the only state in the Union to not dedicate any land to growing the crop.
Caveats
- The data is from 2016.
- The borders represent the area of the state if it were based on wheat production. The location of the states on the map is irrelevant.
- The map is presented in an Albers equal-area conic projection.
- The choropleth classification is based on Jenks or natural breaks.
Details
It is interesting to note that the majority of wheat production in the European Union comes from relatively small-sized states. The only large state to dedicate a significant amount of land to wheat production is Sweden.
The total reported area dedicated to the crop in the European Union is 5,575,330 hectares (13,776,940 acres) or 55,753.3 square kilometers (21,526.35 square miles).
Data
| State | Hectares Harvested | Percent of EU Total |
|---|---|---|
| Lithuania | 880,530 | 15.79 |
| Czech Republic | 839,710 | 15.06 |
| Denmark | 583,000 | 10.46 |
| Greece | 536,780 | 9.63 |
| Latvia | 479,100 | 8.59 |
| Sweden | 449,150 | 8.06 |
| Slovakia | 417,710 | 7.49 |
| Austria | 317,760 | 5.7 |
| Belgium | 215,720 | 3.87 |
| Finland | 215,100 | 3.86 |
| Croatia | 171,400 | 3.07 |
| Estonia | 164,500 | 2.95 |
| Netherlands | 127,090 | 2.28 |
| Ireland | 67,920 | 1.22 |
| Portugal | 38,200 | 0.69 |
| Slovenia | 31,460 | 0.56 |
| Luxembourg | 13,810 | 0.25 |
| Cyprus | 8,390 | 0.15 |
| France | 5,000 | 0.09 |
| Germany | 3,000 | 0.05 |
| Spain | 2,000 | 0.04 |
| Poland | 2,000 | 0.04 |
| Romania | 2,000 | 0.04 |
| Bulgaria | 1,000 | 0.02 |
| Italy | 1,000 | 0.02 |
| Hungary | 1,000 | 0.02 |
| United Kingdom | 1,000 | 0.02 |
| Malta | 0 | 0 |
Sources
Eurostat. 2017. "Database - Eurostat." Accessed November 26, 2017. http://ec.europa.eu/eurostat/data/database.