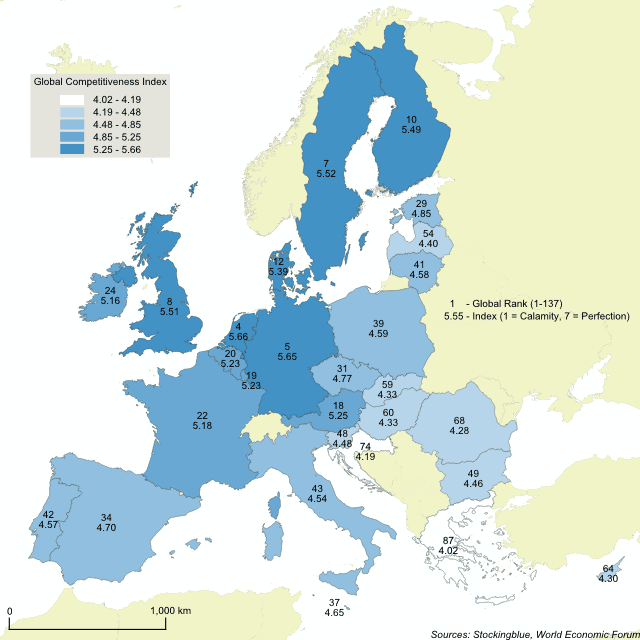
The World Economic Forum published its annual Global Competitiveness Index (GCI) recently and while some states of the European Union faired spectacularly others, not so much. Half of the world's top ten most competitive nations are in the EU, namely the Netherlands, Germany, Sweden, the United Kingdom, and Finland. The Index is made up of 114 factors ranging from property rights to reliability of police services and from the quality of roads to the prevalence of various diseases. These 114 variables are broken up into 11 categories or "pillars" as the Index puts it: institutions, infrastructure, macroeconomic environment, health and primary education, higher education and training, goods market efficiency, labor market efficiency, financial market development, technological readiness, market size, business sophistication, and innovation.
Findings
- The Netherlands has the highest score in the European Union at 5.39 or 77.67 percent on a scale of 0-100. That's pretty low considering it is ranked fourth globally.
- Greece has the lowest score in the European Union at 4.02 or 50.33 on a scale of 0-100. Ranked at 87th globally, it is closer to the last ranked nation than to the first (there are 137 nations in the study).
- Greece and Croatia are the only two EU countries whose rank is closer to the last international ranked country than the first.
- Only four EU countries manage a score above 5.5 or 75 percent on a scale of 0-100. The GCI uses a range of 1-7 for some odd reason.
Caveats
- The data is from 2016.
- The GCI uses a score that ranges from one to seven, the table below also provides the equivalent on a scale of 0-100.
- The map is presented in an Albers equal-area conic projection.
- The choropleth classification is based on Jenks or natural breaks.
Details
The difference between the best EU nation and the worst is 27.34 points on a scale of 0-100.
With the exception of Finno-Ugric, competitiveness tends to match pretty well with language groups with the states that speak a Germanic tongue the most competitive followed by Romance, Celtic, Semitic, Slavic, and finally Greek.
Data
| State | GCI Score | Score on Scale of 0-100 |
|---|---|---|
| Netherlands | 5.66 | 77.67 |
| Germany | 5.65 | 77.5 |
| Sweden | 5.52 | 75.33 |
| United Kingdom | 5.51 | 75.17 |
| Finland | 5.49 | 74.83 |
| Denmark | 5.39 | 73.17 |
| Austria | 5.25 | 70.83 |
| Luxembourg | 5.23 | 70.5 |
| Belgium | 5.23 | 70.5 |
| France | 5.18 | 69.67 |
| Ireland | 5.16 | 69.33 |
| Estonia | 4.85 | 64.17 |
| Czech Republic | 4.77 | 62.83 |
| Spain | 4.7 | 61.67 |
| Malta | 4.65 | 60.83 |
| Poland | 4.59 | 59.83 |
| Lithuania | 4.58 | 59.67 |
| Portugal | 4.57 | 59.5 |
| Italy | 4.54 | 59 |
| Slovenia | 4.48 | 58 |
| Bulgaria | 4.46 | 57.67 |
| Latvia | 4.4 | 56.67 |
| Slovakia | 4.33 | 55.5 |
| Hungary | 4.33 | 55.5 |
| Cyprus | 4.3 | 55 |
| Romania | 4.28 | 54.67 |
| Croatia | 4.19 | 53.17 |
| Greece | 4.02 | 50.33 |
Sources
Schwab, Klaus. 2017. "The Global Competitiveness Report: 2017-2018." World Economic Forum. http://www3.weforum.org/docs/GCR2017-2018/05FullReport/TheGlobalCompetitivenessReport2017%E2%80%932018.pdf.