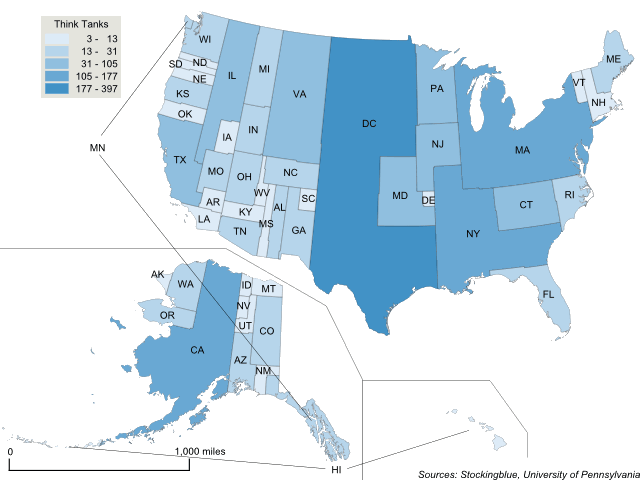
The geographically accurate cartogram above represents the size of the states based on their number of think tanks. Washington DC contains one out of every five think tanks in the US. Think tanks are clearly an east coast phenomenon.
Findings
- Washington DC accounts for the greatest number of think tanks in the US. It alone is responsible for just over one out of every five think tanks in the country.
- Delaware and Alaska, the states with the least think tanks attribute 0.16 percent of the total think tanks in the EU each.
- Three states and the capital (DC, Massachusetts, California, and New York) are responsible for just under half the think tanks.
- Wyoming is the only state without a single think tank.
Caveats
- The data is from 2016.
- The borders represent the area of the state if it were based on the number of think tanks. The larger the state, the more think tanks it has.
- The map is presented in an Albers equal-area conic projection.
- The choropleth classification is based on Jenks or natural breaks.
- The two insets have the same scale as the main map.
- Wyoming has no think tanks and thus does not appear on the map.
Details
Think tanks dominate east of the Mississippi River. The only state to have more than 50 think tanks west of the Mississippi is California whereas six states meet that threshold on the east. Only three states west of the Mississippi have more than 25 think tanks (California, Texas, Colorado) whereas 13 states meet the threshold east of the Mississippi.
The total reported number of think tanks in the United States is 1,834.
Data
| State | Think Tanks | Percent of US Total |
|---|---|---|
| Washington DC | 397 | 21.65 |
| Massachusetts | 177 | 9.65 |
| California | 169 | 9.21 |
| New York | 144 | 7.85 |
| Virginia | 105 | 5.73 |
| Illinois | 62 | 3.38 |
| Maryland | 50 | 2.73 |
| Texas | 47 | 2.56 |
| Connecticut | 44 | 2.4 |
| Pennsylvania | 42 | 2.29 |
| New Jersey | 36 | 1.96 |
| Colorado | 31 | 1.69 |
| Florida | 31 | 1.69 |
| Michigan | 31 | 1.69 |
| Georgia | 29 | 1.58 |
| Ohio | 25 | 1.36 |
| Minnesota | 23 | 1.25 |
| North Carolina | 23 | 1.25 |
| Washington | 23 | 1.25 |
| Wisconsin | 22 | 1.2 |
| Arizona | 21 | 1.15 |
| Indiana | 21 | 1.15 |
| Maine | 21 | 1.15 |
| Rhode Island | 20 | 1.09 |
| Tennessee | 19 | 1.04 |
| Missouri | 18 | 0.98 |
| Kansas | 17 | 0.93 |
| Alabama | 16 | 0.87 |
| Oregon | 16 | 0.87 |
| New Hampshire | 13 | 0.71 |
| Hawaii | 12 | 0.65 |
| Kentucky | 11 | 0.6 |
| Oklahoma | 11 | 0.6 |
| Iowa | 10 | 0.55 |
| Louisiana | 10 | 0.55 |
| Mississippi | 10 | 0.55 |
| Arkansas | 8 | 0.44 |
| Montana | 8 | 0.44 |
| Nebraska | 7 | 0.38 |
| New Mexico | 7 | 0.38 |
| Utah | 7 | 0.38 |
| South Carolina | 6 | 0.33 |
| West Virginia | 6 | 0.33 |
| South Dakota | 5 | 0.27 |
| Vermont | 5 | 0.27 |
| Idaho | 4 | 0.22 |
| Nevada | 4 | 0.22 |
| North Dakota | 4 | 0.22 |
| Alaska | 3 | 0.16 |
| Delaware | 3 | 0.16 |
| Wyoming | 0 | 0 |
Sources
McGann, James G. 2017. "2016 Global Go to Think Tank Index Report." University of Pennsylvania. http://repository.upenn.edu/think_tanks/12/?utm_source=repository.upenn.edu%2Fthink_tanks%2F12&utm_medium=PDF&utm_campaign=PDFCoverPages.