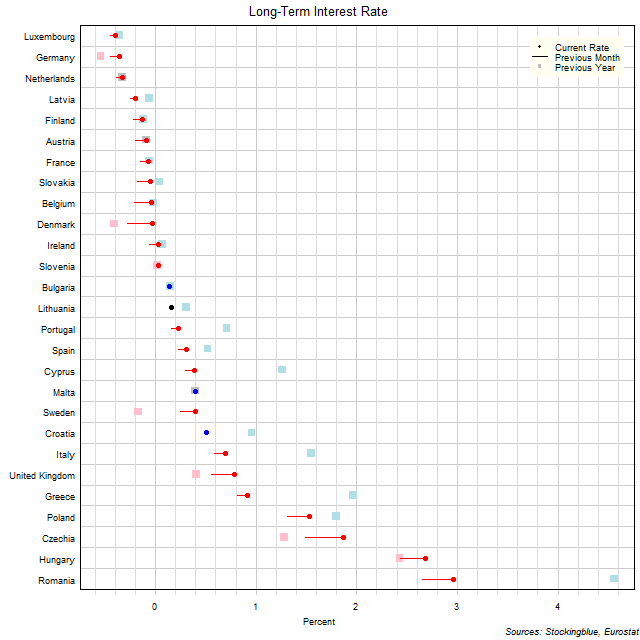
The chart above shows the ten-year interest rate in each EU state as of March 2021, the change from the previous month, and the rate one year prior. Ten states have a negative interest rate (down from 11 last month and same as 10 last year).
Findings
- The difference (spread) between the state with the lowest long-term interest rate, Luxembourg, and the state with the highest, Romania, is 3.36 percentage points (up from 3.10 last month and down from 5.10 last year). Germany and Luxembourg had the lowest rate last month and Germany had the lowest rate last year. Romania had the highest rate last month and last year.
- The median long-term interest rate in the 28 EU states is 0.16 (same as 0.16 the previous month and up from 0.15 last year) and the mean 0.46 (up from 0.34 the previous month and down from 0.60 last year).
- Of the 27 states, one saw no change in the long-term interest rate from the previous month, three saw the rate decrease, and 23 saw the rate increase.
- Of the 27 states, three saw no change in the long-term interest rate from last year, 17 saw the rate decrease, and seven saw the rate increase.
Caveats
- Data is from March 2020, February 2021, and March 2021.
- Estonia does not currently issue any sovereign debt that complies with the definition of long-term interest rates for convergence purposes and no suitable proxy indicator has been identified, therefore there is no data available for Estonia.
- All figures are rounded to the nearest hundredth.
Details
Bulgaria, Croatia, and Malta saw the rate drop the most over the previous month dropping 0.01 percentage point. On the flip side, Czechia saw the rate rise the most gaining 0.38 percentage points. Year over year, Romania saw the rate drop the most with a 1.60 percentage point drop while Czechia saw the rate rise the most gaining 0.59 percentage points.
France (from 10th lowest rate to 7th lowest rate) rose three spots over the course of the month. Conversely, Denmark (from 4th to 10th) fell six spots.
Over the course of the year, Latvia (from 8th to 4th), Slovakia (from 12th to 8th), Portugal (from 19th to 15th), and Cyprus (from 21st to 17th) rose four spots. On the flip side, Sweden (from 5th to 18th) fell 13 spots.
For reference, the United States' ten-year note was 0.88% in March 2020, 1.25% in February 2021, and 1.61% in March 2021, meaning that Czechia, Hungary, and Romania have higher rates than the US. Japan's ten-year rate was -0.03% in March 2020, 0.09% in February 2021, and 0.10% in March 2021 being bested by Luxembourg, Germany, the Netherlands, Latvia, Finland, Austria, France, Slovakia, Belgium, Denmark, Ireland, and Slovenia.
Data
| State | March 2020 | February 2021 | March 2021 |
|---|---|---|---|
| Austria | -0.09 | -0.2 | -0.09 |
| Belgium | -0.02 | -0.21 | -0.04 |
| Bulgaria | 0.15 | 0.15 | 0.14 |
| Croatia | 0.96 | 0.52 | 0.51 |
| Cyprus | 1.26 | 0.3 | 0.39 |
| Czechia | 1.28 | 1.49 | 1.87 |
| Denmark | -0.41 | -0.28 | -0.03 |
| Finland | -0.12 | -0.22 | -0.13 |
| France | -0.06 | -0.15 | -0.07 |
| Germany | -0.54 | -0.45 | -0.36 |
| Greece | 1.97 | 0.81 | 0.91 |
| Hungary | 2.43 | 2.43 | 2.68 |
| Ireland | 0.07 | -0.06 | 0.03 |
| Italy | 1.55 | 0.59 | 0.7 |
| Latvia | -0.06 | -0.25 | -0.2 |
| Lithuania | 0.31 | 0.16 | 0.16 |
| Luxembourg | -0.36 | -0.45 | -0.4 |
| Malta | 0.4 | 0.41 | 0.4 |
| Netherlands | -0.33 | -0.39 | -0.33 |
| Poland | 1.8 | 1.31 | 1.53 |
| Portugal | 0.71 | 0.16 | 0.23 |
| Romania | 4.56 | 2.65 | 2.96 |
| Slovakia | 0.04 | -0.18 | -0.05 |
| Slovenia | 0.02 | 0.02 | 0.03 |
| Spain | 0.52 | 0.23 | 0.31 |
| Sweden | -0.17 | 0.25 | 0.4 |
| United Kingdom | 0.41 | 0.56 | 0.78 |
Sources
Eurostat. 2021. "EMU Convergence Criterion Series - Monthly Data." Accessed May 6, 2021. https://appsso.eurostat.ec.europa.eu/nui/show.do?query=BOOKMARK_DS-055774_QID_3B680602_UID_-3F171EB0&layout=TIME,C,X,0;GEO,L,Y,0;INT_RT,L,Z,0;INDICATORS,C,Z,1;&zSelection=DS-055774INDICATORS,OBS_FLAG;DS-055774INT_RT,MCBY;&rankName1=INDICATORS_1_2_-1_2&rankName2=INT-RT_1_2_-1_2&rankName3=TIME_1_0_0_0&rankName4=GEO_1_2_0_1&sortC=ASC_-1_FIRST&rStp=&cStp=&rDCh=&cDCh=&rDM=true&cDM=true&footnes=false&empty=false&wai=false&time_mode=NONE&time_most_recent=false&lang=EN&cfo=%23%23%23%2C%23%23%23.%23%23%23.
Eurostat. 2021. "Government Bond Yields, Ten Years' Maturity - Monthly Data." Accessed May 6, 2021. https://appsso.eurostat.ec.europa.eu/nui/show.do?query=BOOKMARK_DS-054880_QID_-5E6A6AF7_UID_-3F171EB0&layout=TIME,C,X,0;GEO,L,Y,0;MATURITY,L,Z,0;INDICATORS,C,Z,1;&zSelection=DS-054880INDICATORS,OBS_FLAG;DS-054880MATURITY,Y10;&rankName1=MATURITY_1_2_-1_2&rankName2=INDICATORS_1_2_-1_2&rankName3=TIME_1_0_0_0&rankName4=GEO_1_2_0_1&sortC=ASC_-1_FIRST&rStp=&cStp=&rDCh=&cDCh=&rDM=true&cDM=true&footnes=false&empty=false&wai=false&time_mode=NONE&time_most_recent=false&lang=EN&cfo=%23%23%23%2C%23%23%23.%23%23%23.