EU Regional Crude Oil Production, January 2019

The chart above shows the crude oil production in each EU region as of January 2019 in thousands of metric tons, the change from the previous month, and the production one year prior. The Eastern EU surpassed the Northern EU in crude production.
US Regional Crude Oil Production, January 2019

The chart above shows the crude oil production in each US region as of January 2019 in thousands of barrels, the change from the previous month, and the production one year prior. The Northeast produces almost no crude at all.
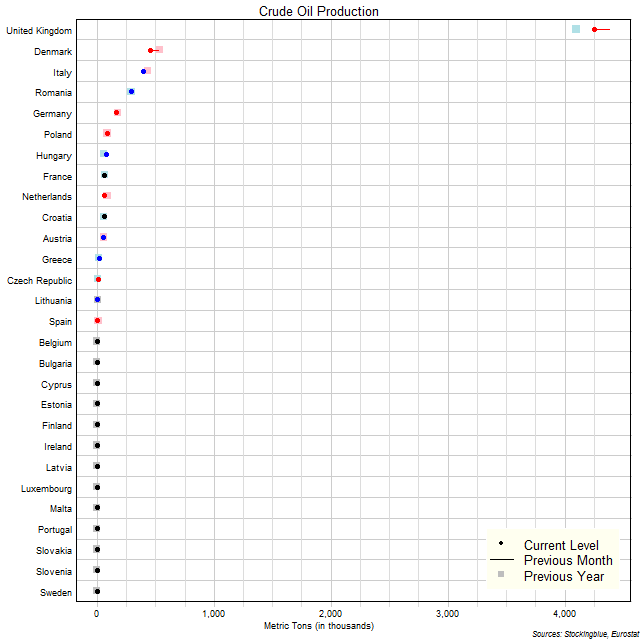
EU Crude Oil Production, January 2019

The chart above shows the crude oil production in each EU state as of January 2019 (unless otherwise noted - see caveats below) in thousands of metric tons, the change from the previous month, and the production one year prior. The United Kingdom dominates over the other states.
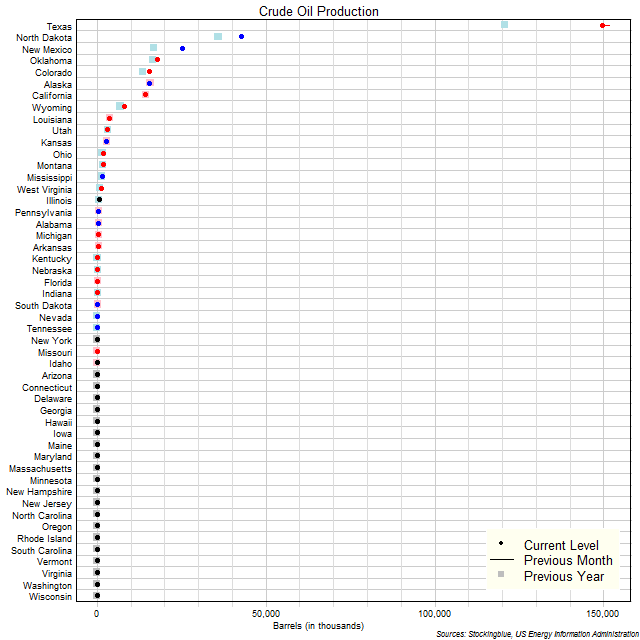
US Crude Oil Production, January 2019

The chart above shows the crude oil production in each US state as of January 2019 in thousands of barrels, the change from the previous month, and the production one year prior. Texas is in a league all its own.
US Regional Unemployment Rates, March 2019

The chart above shows the unemployment rate in each US region as of March 2019, the change from the previous month, and the rate one year prior. The Northeast was the only region to see an improvement in its rate both from last month and last year.
EU Regional Unemployment Rates, March 2019

The chart above shows the unemployment rate in each EU region as of March 2019 (unless otherwise noted - see caveats below), the change from the previous month, and the rate one year prior. The Northern EU is the only region with an unemployment rate larger than the previous month as well as larger than last year.
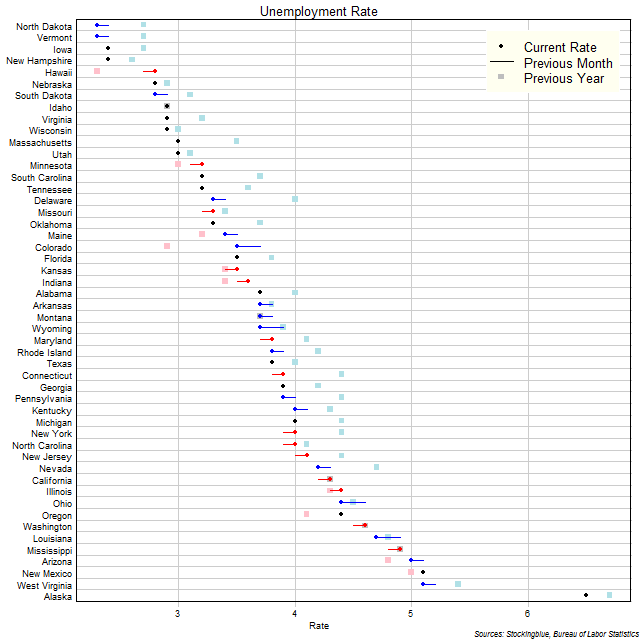
US Unemployment Rates, March 2019

The chart above shows the unemployment rate in each US state as of March 2019, the change from the previous month, and the rate one year prior. Four states, Iowa, New Hampshire, North Dakota, and Vermont are the only states that continue to have an unemployment rate below 2.5 percent.
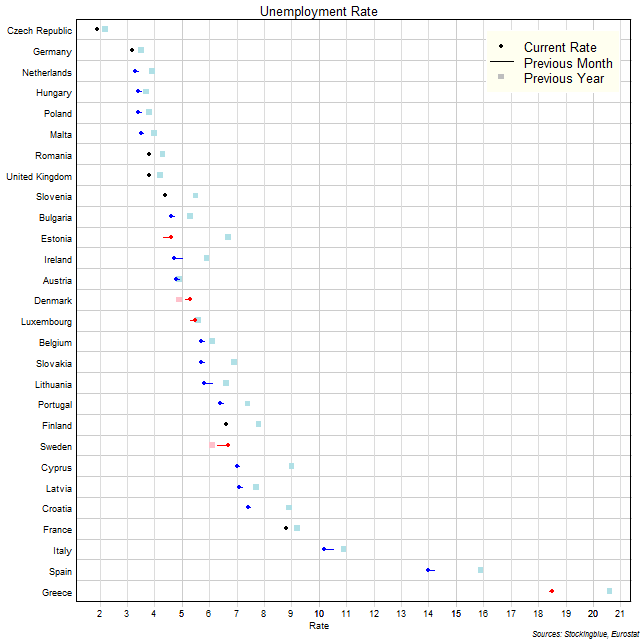
EU Unemployment Rates, March 2019

The chart above shows the unemployment rate in each EU state as of March 2019 (unless otherwise noted - see caveats below), the change from the previous month, and the rate one year prior. The Czech Republic continues to be the only state with an unemployment rate below three percent.
EU Regions by Annual Riders per Kilometer of Subway Track

The chart above shows the number of annual riders for every kilometer of track in each EU region. One million annual riders is the equivalent of 2,740 riders a day. The Eastern EU is the only region with over 4 million annual riders for every kilometer of subway track.
US Regions by Annual Riders per Mile of Subway Track

The chart above shows the number of annual riders for every mile of track in each US region. One million annual riders is the equivalent of 2,740 riders a day. Unsurprisingly, the Northeast dominates in this metric.
OlderNewer