Transportation Based Carbon Dioxide Emissions in US States
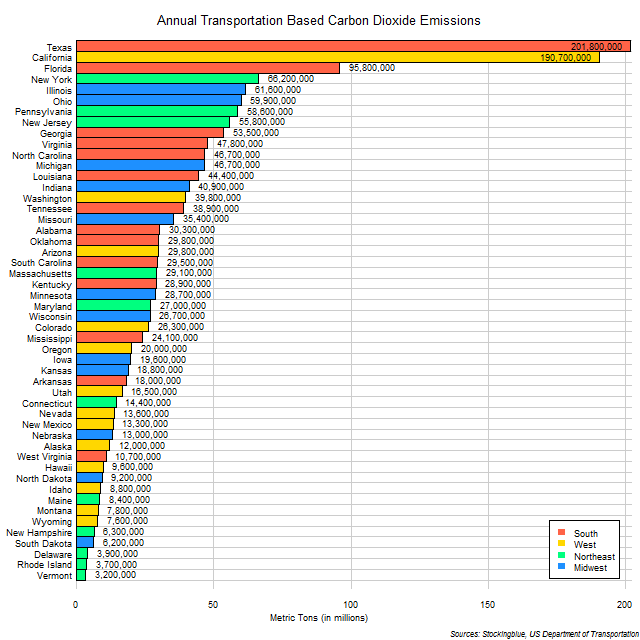
The chart above shows transportation based carbon dioxide emissions in US states. One-quarter of all carbon dioxide emissions from transportation use come from three states: Texas, California, and Florida.
Transportation Based Carbon Dioxide Emissions in EU States
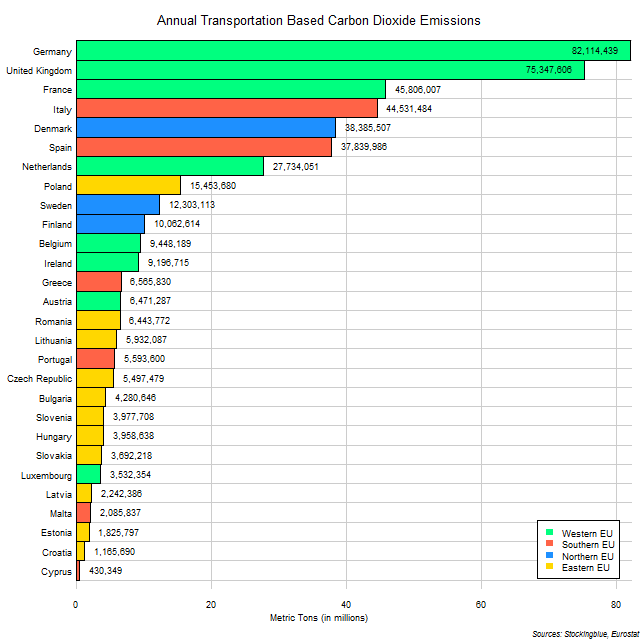
The chart above shows transportation based carbon dioxide emissions in EU states. One-third of all carbon dioxide emissions from transportation use come from two countries: Germany and the United Kingdom, adding in France and Italy makes up more than half of the transportation based carbon dioxide emitted within the EU.
Rail Coverage in US Regions

The chart above shows the miles of rail per square mile of land in US regions. Three regions are all within a tenth of a mile of each other while the West only has a tenth of a mile of rail for every square mile of territory.
Rail Coverage in EU Regions

The chart above shows the kilometers of rail per square kilometer of land in EU regions. Clearly there is a sharp divide between the Western and Eastern EU and the Northern and Southern EU, with the former having around a-tenth of a kilometer of rail per square kilometer of territory and the latter having less than half that.
Kilometers of Railway per Square Kilometer of Land in EU States
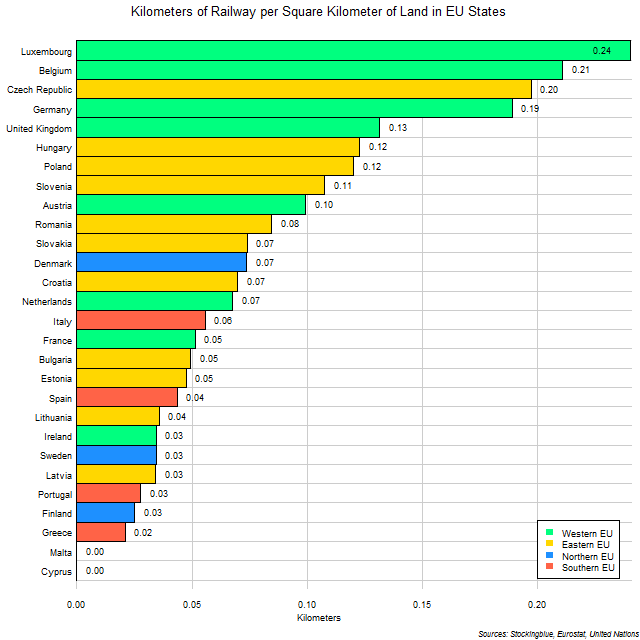
The chart above shows the kilometers of rail per square kilometer of land in EU states. Four states (Luxembourg, Belgium, the Czech Republic, and Germany) are far above their peers in railway coverage. Germany is especially impressive considering the large size of the state.
Miles of Railway per Square Mile of Land in US States
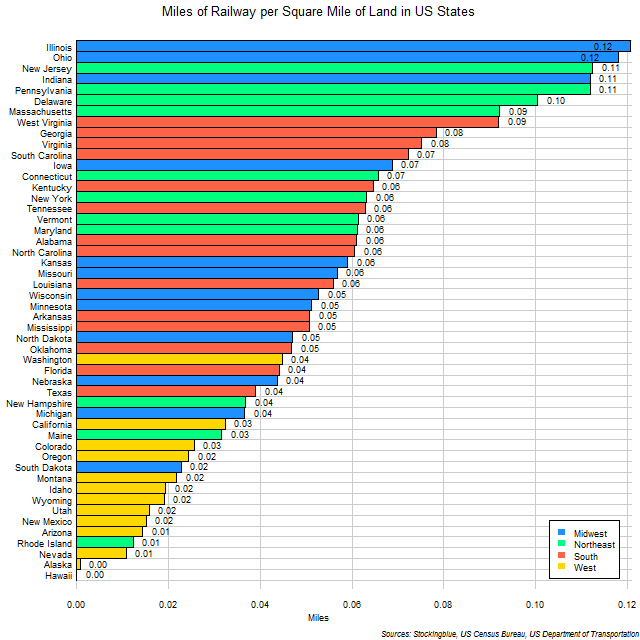
The chart above shows the miles of rail per square mile of land in US states. It's surprising to see that Western states have so little rail compared to the size of their area as rail has been romantically associated with the frontier lands.
Miles of Roadway per Square Mile of Land in US Regions

The chart above shows the miles of roads per square mile of land in US regions. Only the Northeast has more than two miles of road for every square mile of territory. For comparison, a typical Manhattan square mile has approximately 25 miles of roadways.
Kilometers of Roadway per Square Kilometer of Land in EU Regions

The chart above shows the kilometers of roads per square kilometer of land in EU regions. The Northern EU, with its vast expanses of land, is the least paved region per square kilometer. It is also the only region that has less than half of a kilometer of road per every square kilometer of territory.
Kilometers of Roadway per Square Kilometer of Land in EU States
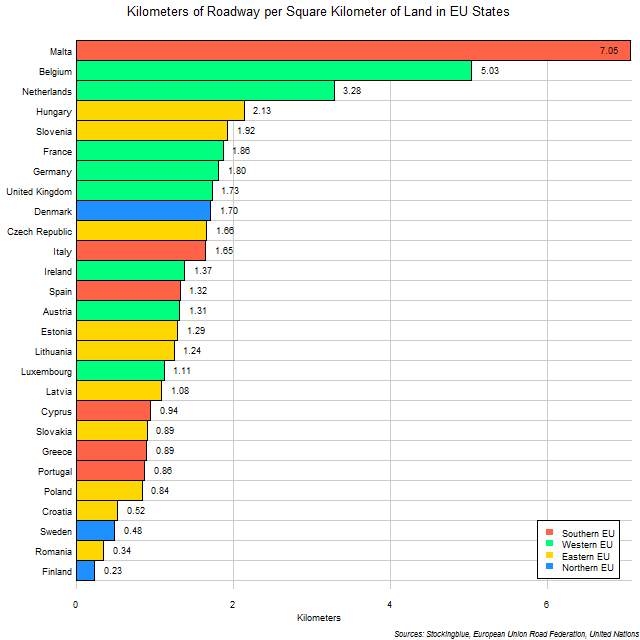
The chart above shows the kilometers of roads per square kilometer of land in EU states. No surprise that small states that are very urban in nature have more roads per square kilometer of territory.
Miles of Roadway per Square Mile of Land in US States
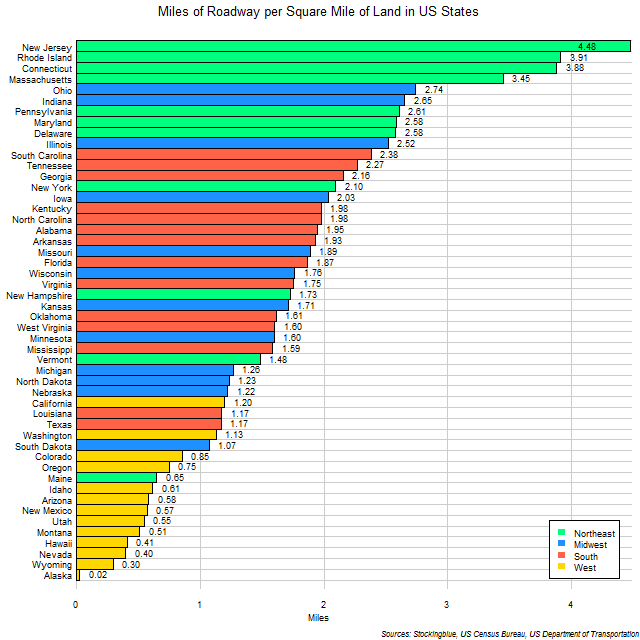
The chart above shows the miles of roads per square mile of land in US states. For comparison, a typical urban square mile in Manhattan has approximately 25 miles of road for every square mile of area. The most densely paved state, New Jersey, does not even come close.
OlderNewer