Vehicles per Thousand Inhabitants in the US
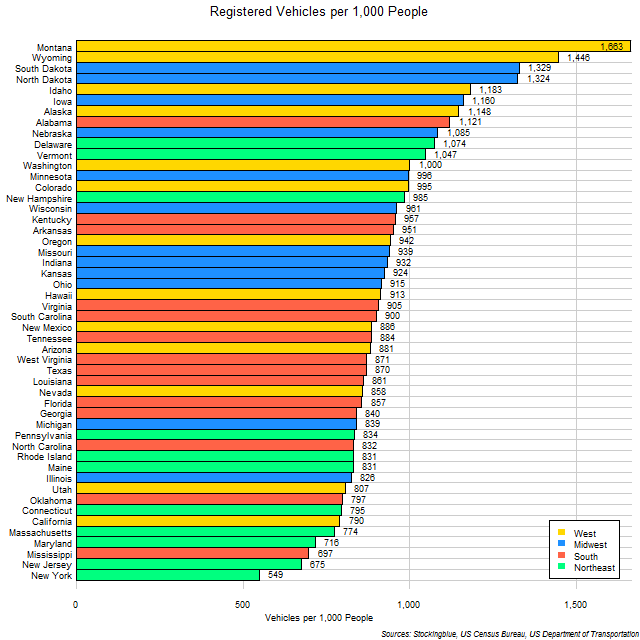
The chart above shows the rate of motor vehicle ownership in US states. Eleven states have more vehicles than people.
Vehicles per Thousand Inhabitants in the EU
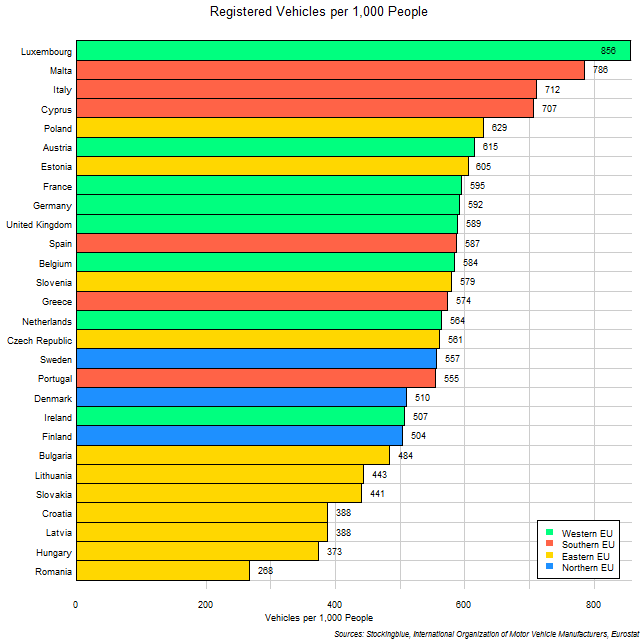
The chart above shows the rate of motor vehicle ownership in EU states. Only states in the Eastern EU have ownership rates of less than one vehicle for every two people.
Vehicle Ownership in EU Regions

The chart above shows the total number of motor vehicles in EU regions. The Western EU has by far, the greatest number of registered vehicles.
Vehicle Ownership in US Regions

The chart above shows the total number of motor vehicles in US regions. The South has by far, the greatest number of registered vehicles.
Population of EU States Visualized
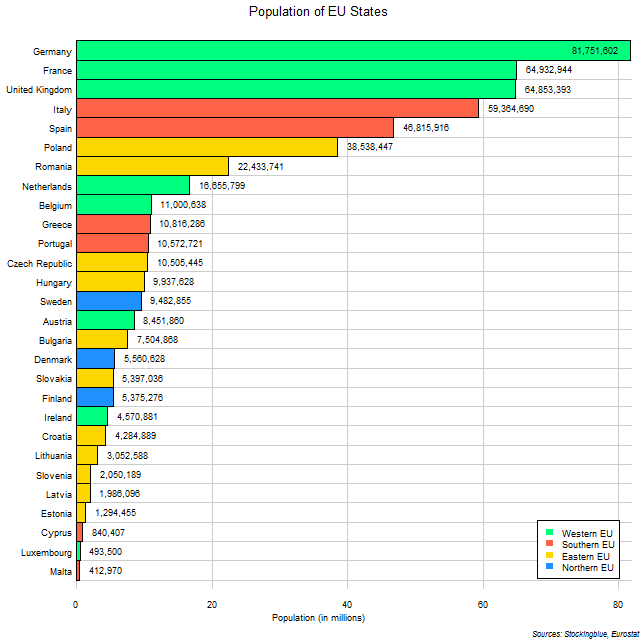
The chart above shows the population of EU states. The Western EU is the only region with states that have populations over 60 million people.
Population of US States Visualized
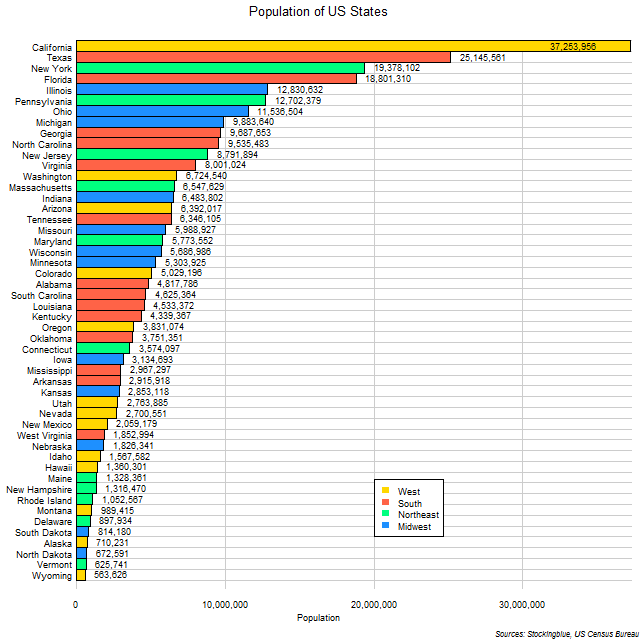
The chart above shows the population of US states. California is by far the most populous state and the Western US has the most and least populous states.
Vehicles in the European Union
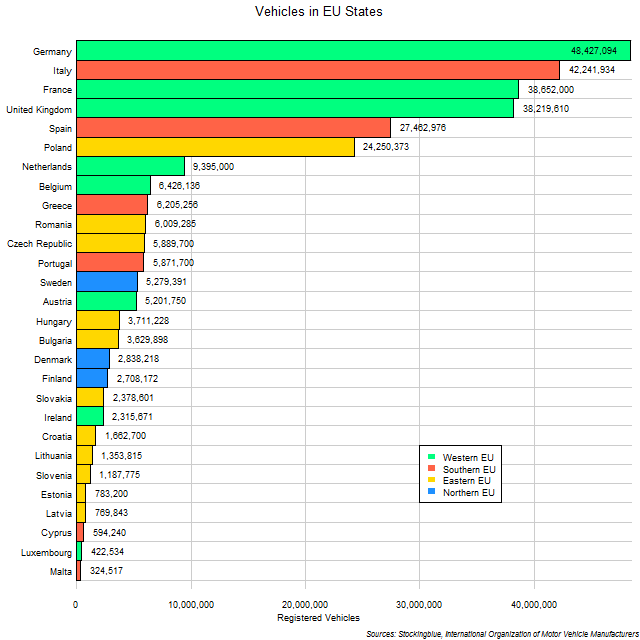
The chart above shows the total number of motor vehicles in EU states. Vehicle ownership correlates pretty strongly with population although there are some notable standouts like Italy which has a smaller population than both France and the United Kingdom but surpasses both in vehicles registered.
Vehicles in the United States
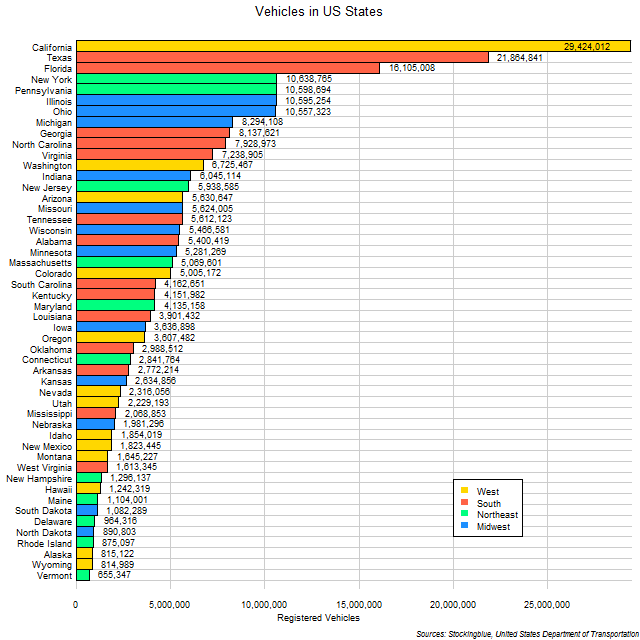
The chart above shows the total number of motor vehicles in US states. It is no surprise that California is the leading state in this metric.
EU Regions by Population Density

The chart above shows the population density of EU regions. The Western EU is the most densely populated while the Northern EU is the most sparsely populated.
US Regions by Population Density

The chart above shows the population density of US regions. The Northeast is clearly the most densely populated region and is so much so that it is over twice as densely populated as the next most densely populated region.
OlderNewer