EU and US States by Length of Subway Track
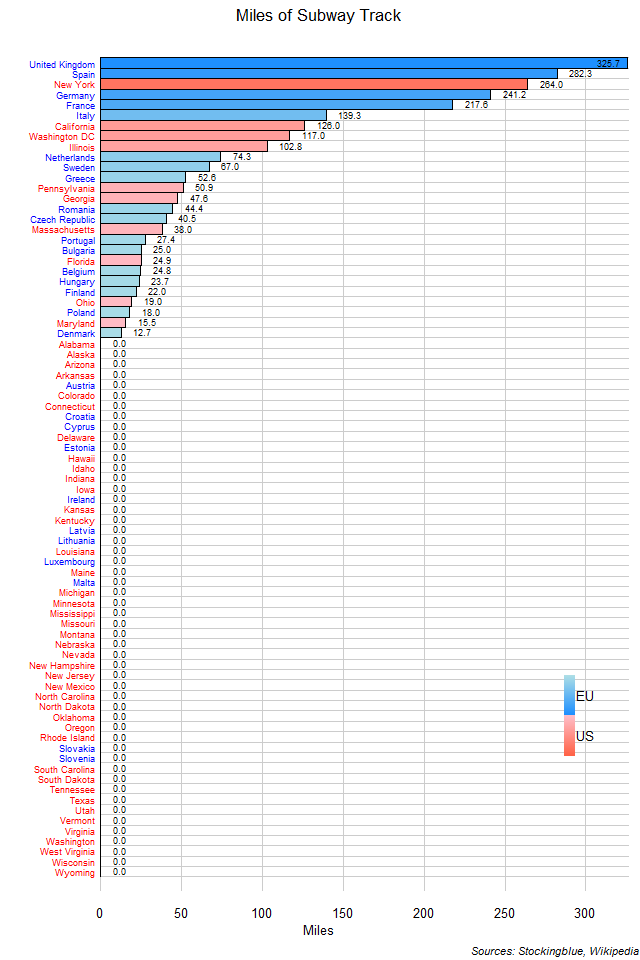
The chart above shows the miles of heavy rail subway track within each EU and US state. The EU dominates over the US in this metric. Not only do EU states have more track laid, but more EU states have subway systems than US states even though there are far more US states.
Unemployment Ratios in EU and US Regions, December 2018
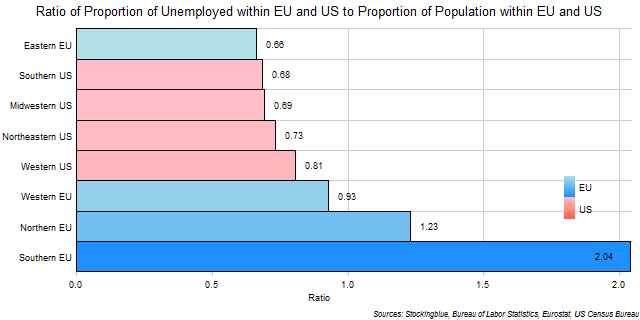
The chart above shows the ratio of the region's proportion of unemployed people in the EU and US to the region's proportion of total people in the EU and US. The Southern EU's unemployed population as a share of the total unemployed population in the EU and the US is twice as large as its total population's share of the total population in the EU and the US.
EU and US Regional Unemployment Rates, December 2018
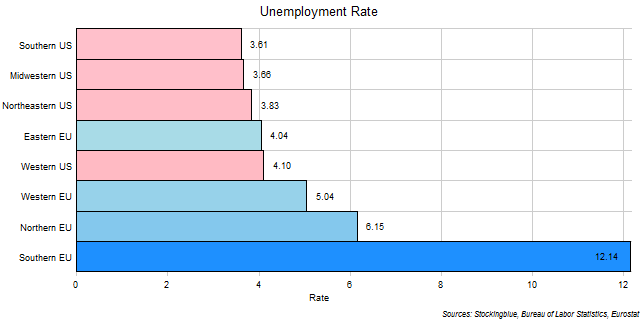
The chart above shows the unemployment rate in each EU and US region as of December 2018. The Southern EU has nearly double the unemployment rate of the next region.
Unemployment Ratios in the EU and the US, December 2018
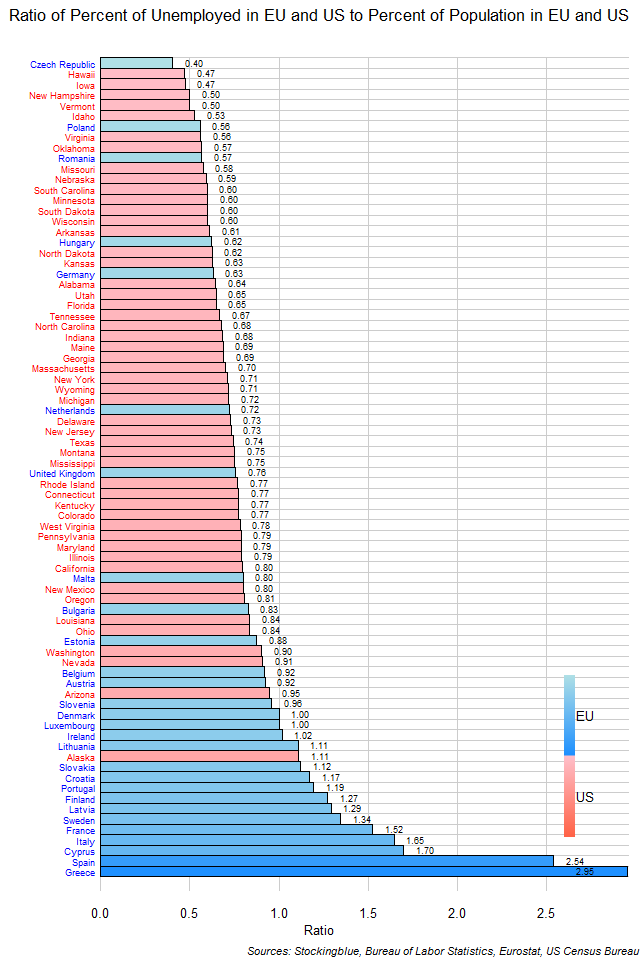
The chart above shows the ratio of the state's proportion of unemployed people in the EU and the US to the state's proportion of total people in the EU and the US. Fourteen states have an unemployed population that makes up a larger proportion of the EU and US total than their total population does. Thirteen of these states are from the EU. The only US state that has a greater proportion of unemployed than total population is Alaska.
EU and US Unemployment Rates, December 2018
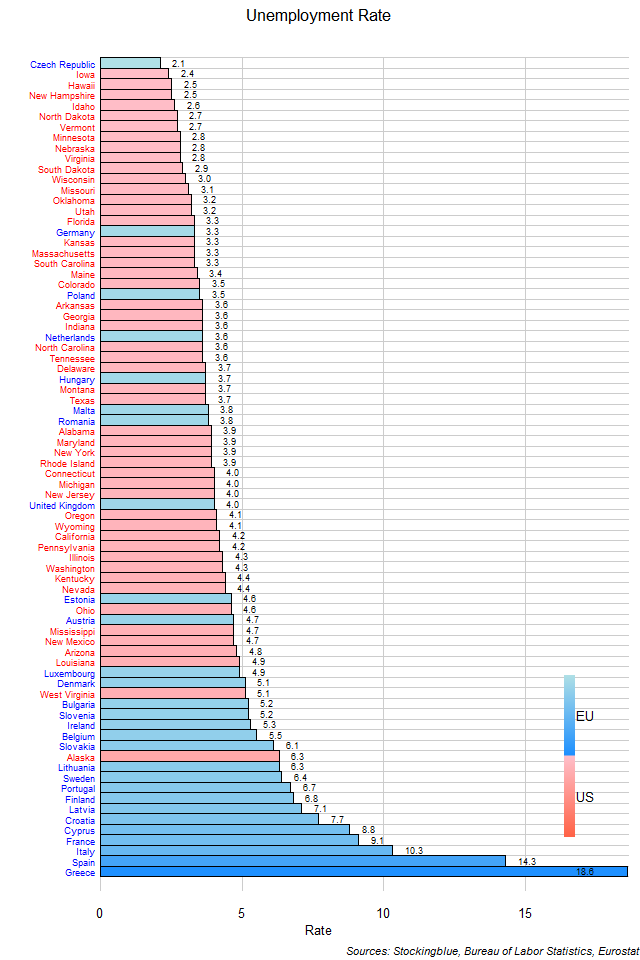
The chart above shows the unemployment rate in each EU and US state as of December 2018 (unless otherwise noted). Although the EU has the state with the lowest unemployment rate, it also has the states with the highest.
Air Travelers per Area in EU and US Regions
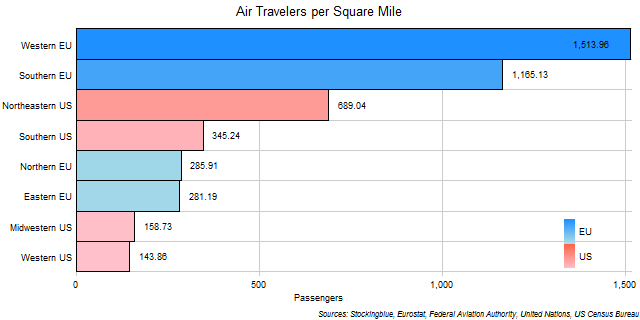
The chart above shows the number of passengers that traveled by air for every square mile in each EU and US region. The leading EU region has more than double the air passengers per square mile than the leading US region.
Air Travelers per Area in EU and US States
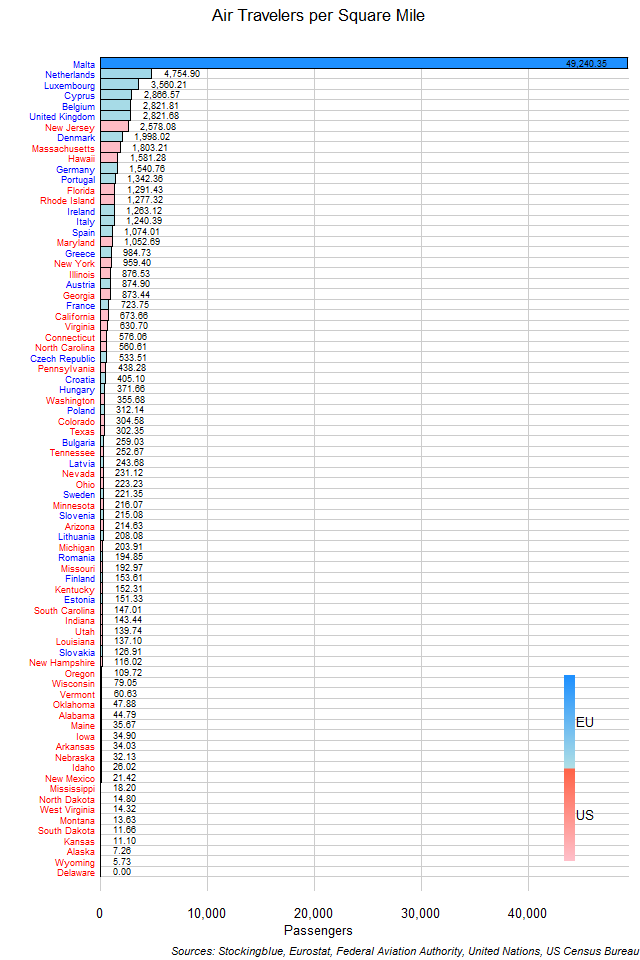
The chart above shows the number of passengers that traveled by air for every square mile in each EU and US state. No state in the EU or the US comes anywhere near the number of air passengers per square mile that Malta has.
Net Worth of Billionaires per Square Mile in EU and US Regions in 2018
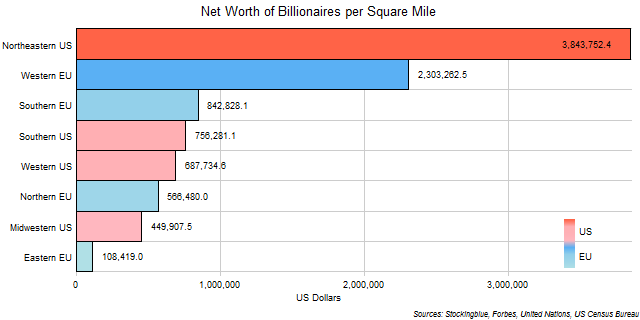
The chart above shows the net worth of the billionaires of each region per square mile. The Northeastern US and the Western EU are the only regions whose billionaires have a net worth per square mile of over $1 million.
Net Worth of Billionaires per Square Mile in EU and US States in 2018
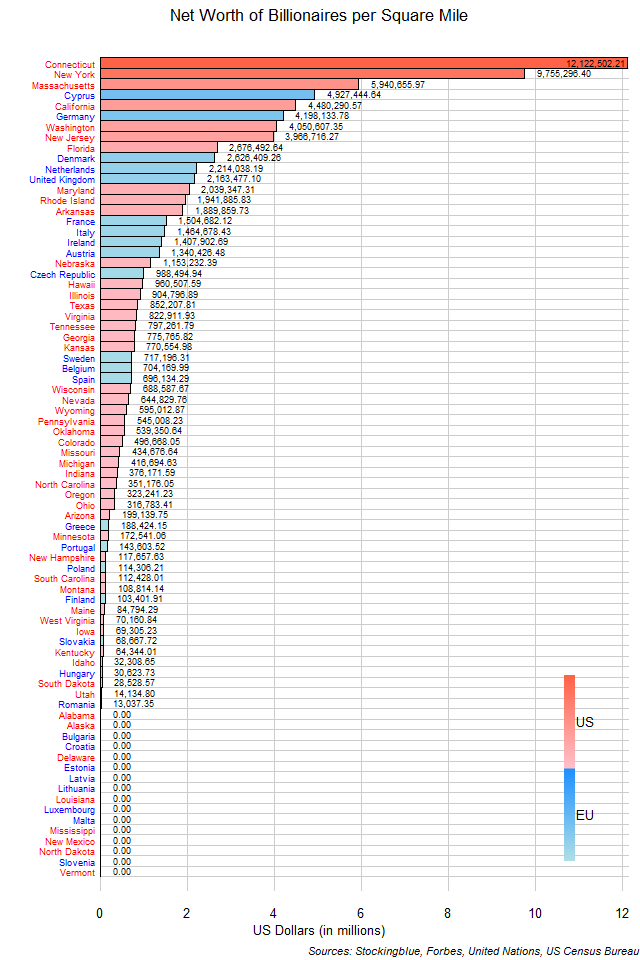
The chart above shows the net worth of the billionaires of each state per square mile. The top three states are all from the US as are four out of the top five and seven out of the top ten.
Average Net Worth of Billionaires in EU and US Regions in 2018
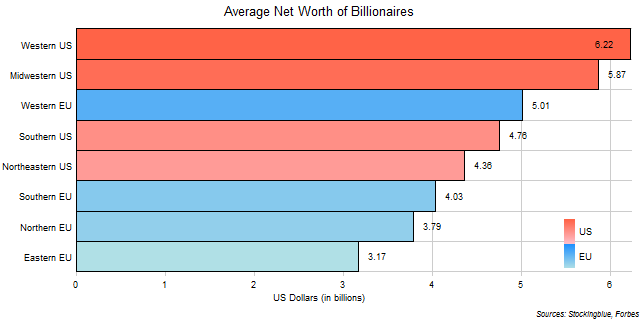
The chart above shows the net worth of the billionaires of each region divided by the population of billionaires in said region. Unlike the previous metric which measured the net worth of billionaires against the total population, this metric shows how wealth is distributed amongst the billionaires of every region. Only the Western US has billionaires who average over $6 billion of net worth.
OlderNewer