Per Capita International Tourists in EU and US States in 2012
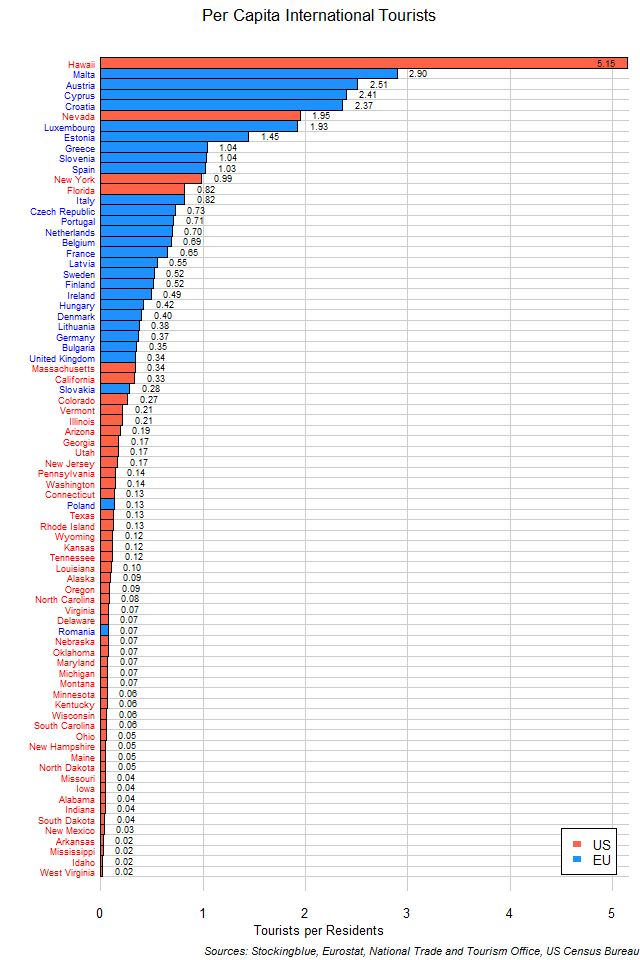
The chart above shows the number of tourists per resident that visited each EU and US state in 2012. Small island states with warm weather do pretty well for themselves, but then again so does a desert (Nevada), people are strange sometimes.
International Tourists in EU and US States in 2012
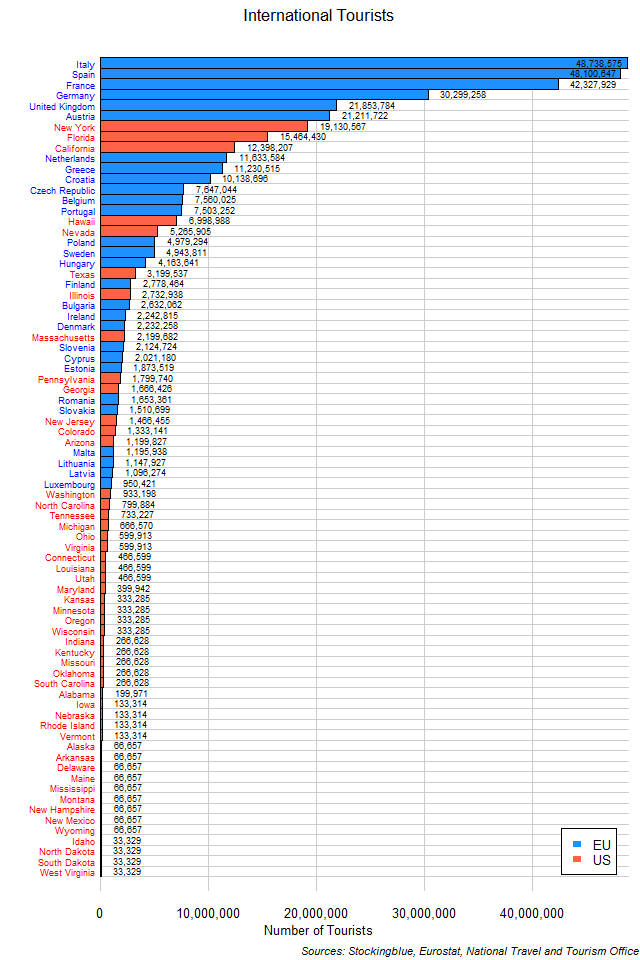
The chart above shows the number of tourists that visited each EU and US state in 2012. EU states account for seven of the top ten states in international tourists. Note however, that US data does not include domestic travelers from other US states whereas EU data does include travelers from other EU countries.
Residential Natural Gas Prices in EU and US Regions in 2016
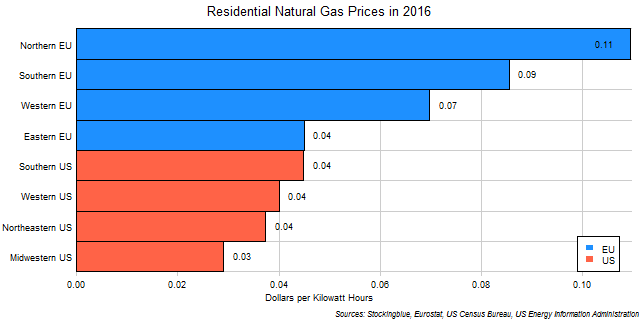
The chart above shows the residential cost of natural gas per kilowatt hour in US dollars for each EU and US region in 2016. Every single EU region has more costly residential natural gas than every single US region.
Residential Natural Gas Prices in EU and US States in 2016
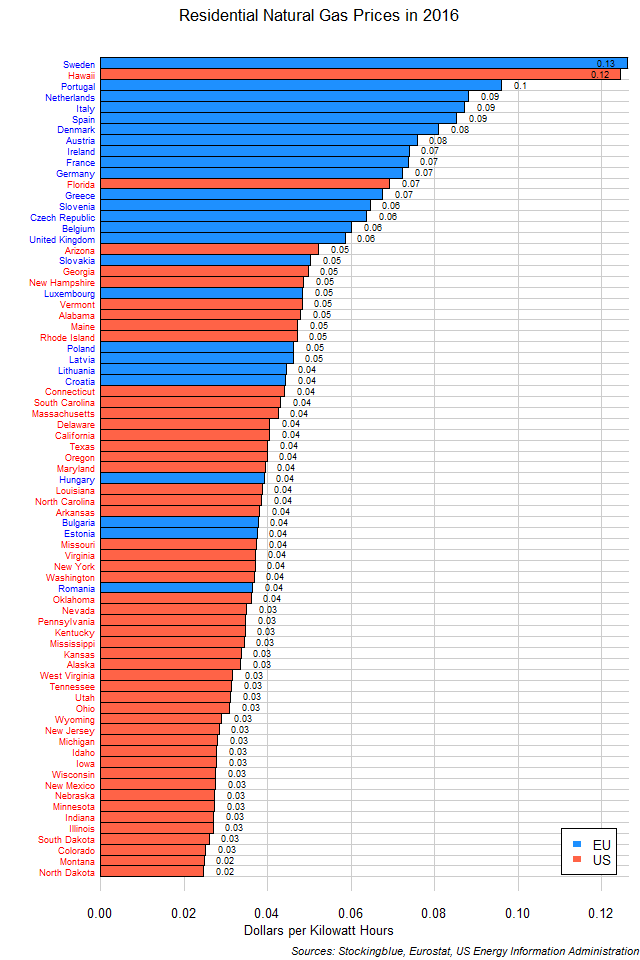
The chart above shows the residential cost of natural gas per kilowatt hour in US dollars for each EU and US state in 2016. Surprisingly, Sweden has higher costs than Hawaii which has serious shipping issues as it is located in the middle of the world's largest ocean.
EU and US Regions' Vacation Spending As Percent of Per Capita GDP in 2015
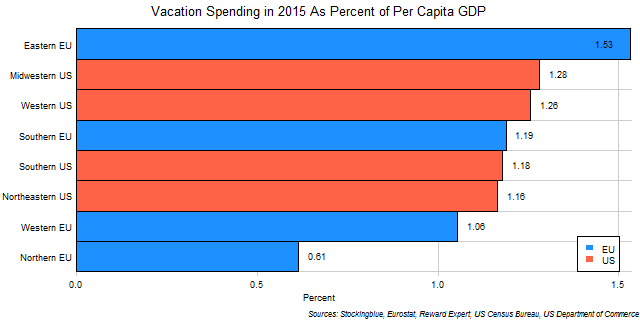
The chart above shows the average vacation expenditures for overnight stays by EU and US region as proportion of per capita GDP. There is a greater discrepancy in vacation spending between regions when per capita GDP is accounted for in the EU than there is in the US.
EU and US Regions' Vacation Spending in 2015
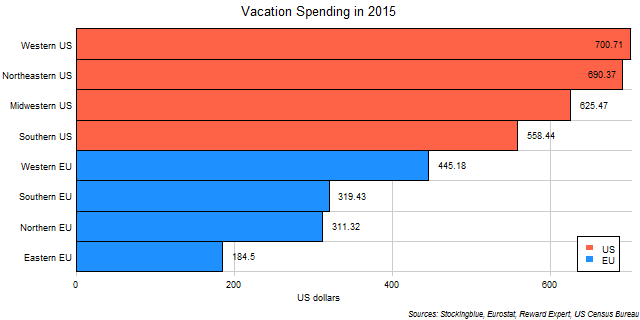
The chart above shows the average vacation expenditures for overnight stays by EU and US region in US dollars. All US regions spend more on vacations than any EU region does.
EU and US States' Vacation Spending As Percent of Per Capita GDP in 2015
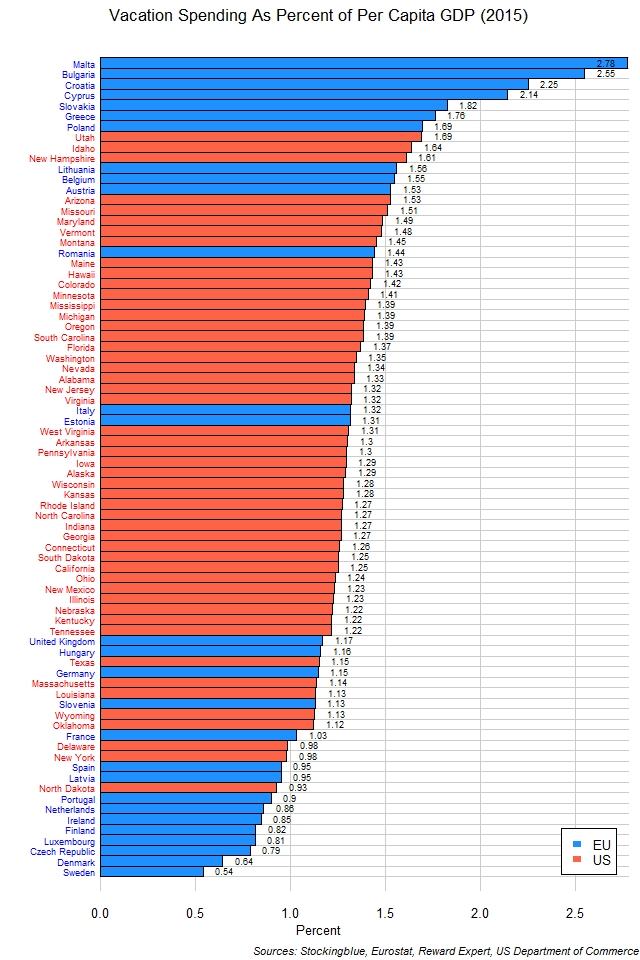
The chart above shows the average vacation expenditures for overnight stays by EU and US state as a proportion of per capita GDP. Americans are more uniform in their vacation spending than Europeans are whose vacation spending ranges from 0.5% of per capita GDP to nearly 3% of per capita GDP.
EU and US States' Vacation Spending in 2015
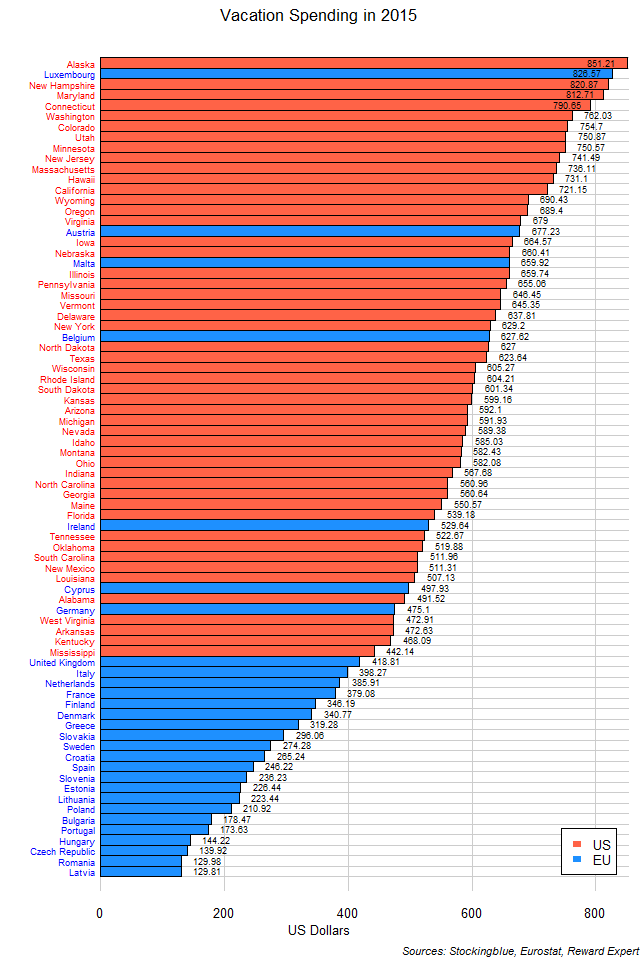
The chart above shows the average vacation expenditures for overnight stays by EU and US state in US dollars. As a whole, Americans spend more on their vacations than their European counterparts do.
Per Capita GDP and Change in Per Capita GDP in EU and US Regions between 2016 and 2017
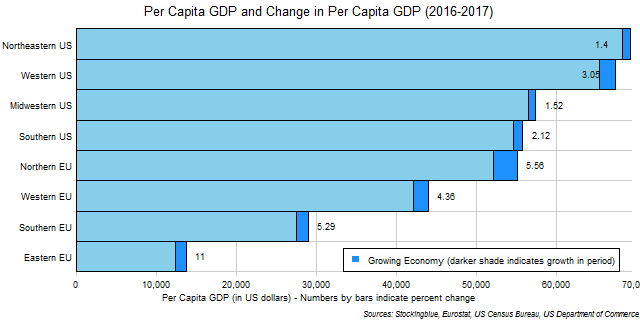
The chart above shows the per capita GDP and change in per capita GDP over the last year in EU and US regions in US dollars. All four US regions have higher per capita GDPs than the four EU regions, however all four EU regions had higher growth rates than all four US regions and if current trends continue, one EU region will overtake one US region this year.
Per Capita GDP and Change in Per Capita GDP in EU and US States between 2016 and 2017
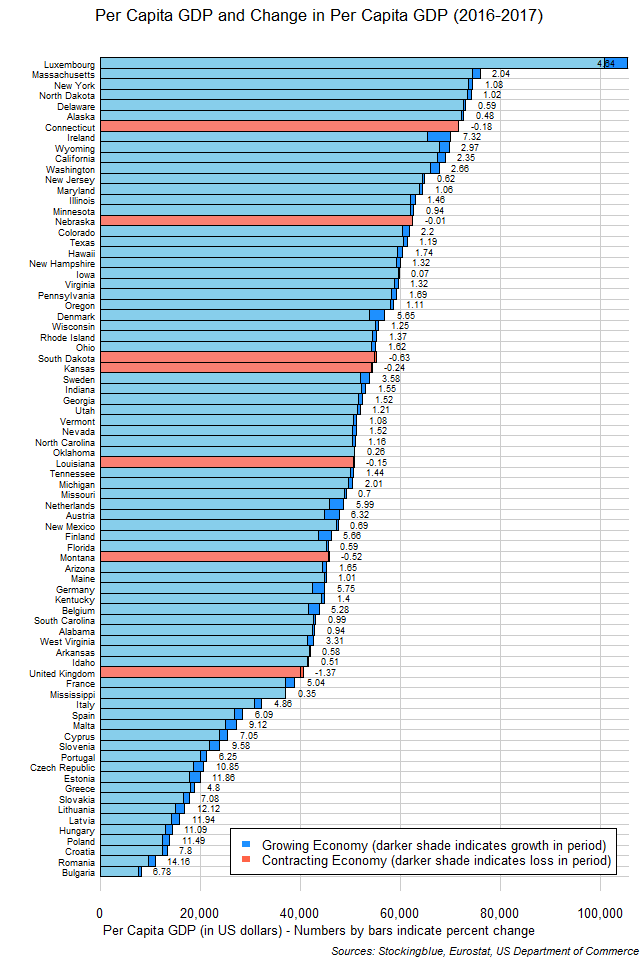
The chart above shows the per capita GDP and change in per capita GDP over the last year in EU and US states in US dollars. Although US states make up eight of the top ten states in per capita GDP, the top state is an EU one, and the top ten growth states as well as growth rate states all come from the EU. The fastest growing US state, Wyoming, comes in 12th with less than half the per capita GDP growth of the fastest growing EU state, Ireland. In addition, the US state with the best growth rate, West Virginia, comes in behind every EU state save for the United Kingdom, with less than one-fourth the growth rate of the leading EU state in the metric, Romania.
OlderNewer