Economic Growth and Contraction in EU and US States between 2008 and 2017
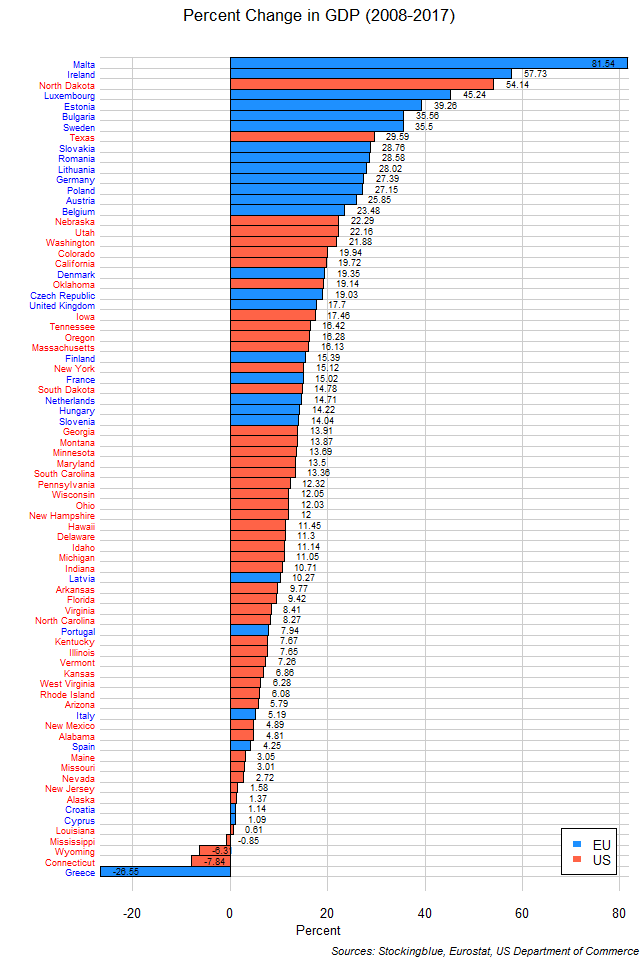
The chart above shows change in GDP over the last ten years in EU and US states. Only two US states rank in the top ten in economic growth over the past decade. Conversely, US states make up seven of the ten worst performers but it is an EU state that has had the worst economic contraction by far.
Per Capita Waterway Coverage in EU and US Regions
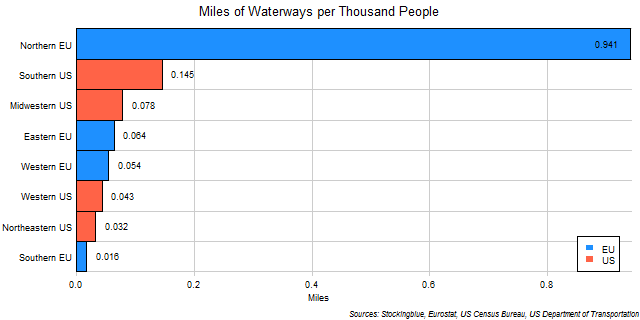
The chart above shows the miles of waterways per thousand people in EU and US regions. Although the Southern US has almost twice as many miles of waterways per capita as the third highest ranked region, the Northern EU has six times as many waterways per capita as the Southern US does.
Per Capita Waterway Coverage in EU and US States
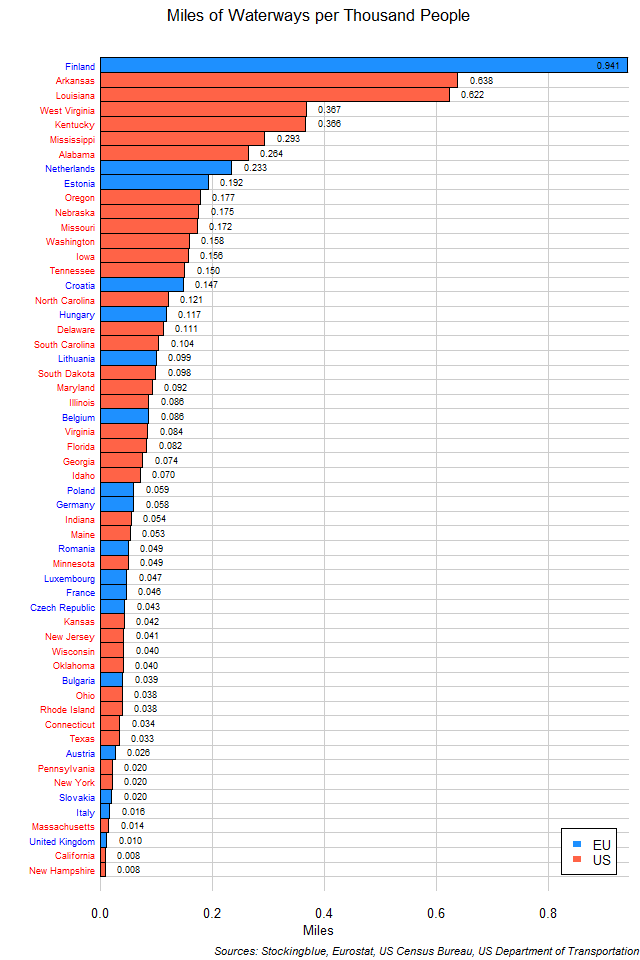
The chart above shows the miles of waterways per thousand people in EU and US states. Finland is in a class all its own, but Arkansas and Louisiana also outperform other states in this metric.
Waterway Coverage in EU and US Regions
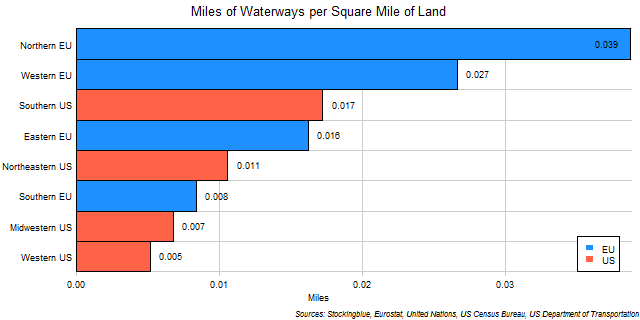
The chart above shows the miles of waterways per square mile of land in EU and US regions. Two EU regions lead in waterway coverage and the leading EU region has more than double the waterway coverage of the leading US region.
Waterway Coverage in EU and US States
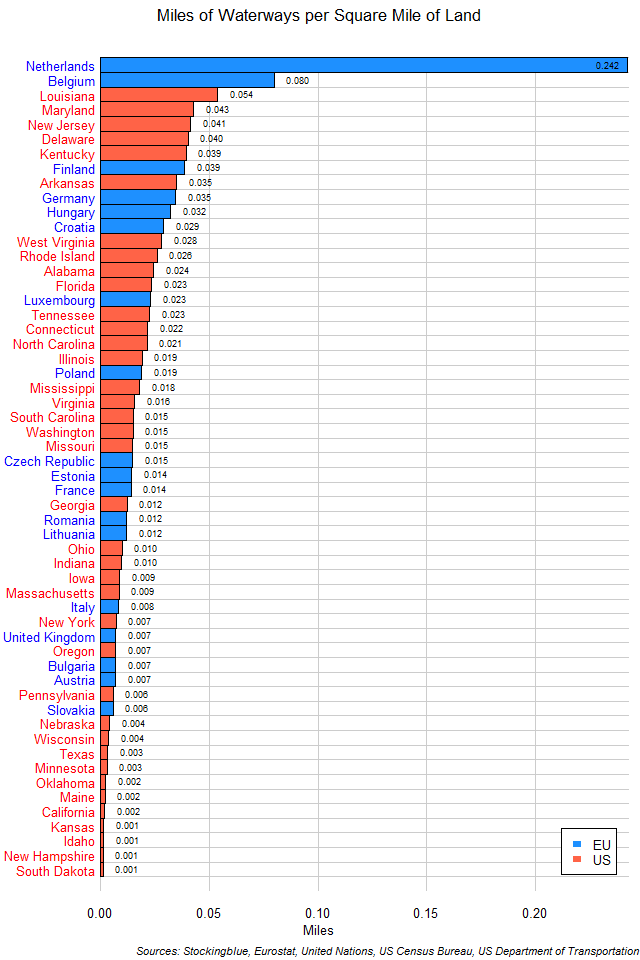
The chart above shows the miles of waterways per square mile of land in EU and US states. The Netherlands has the greatest waterway coverage in the EU and the US by so much that it takes the sum of the next five states to rival the Netherlands' waterway coverage.
Waterways in EU and US Regions
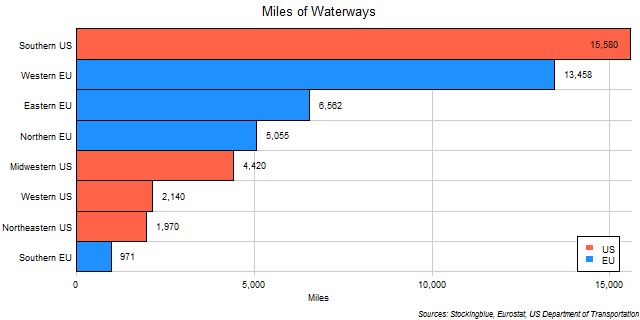
The chart above shows the length of waterways in EU and US regions. The Southern US has the most waterways but it is followed by three EU regions.
Waterways in EU and US States
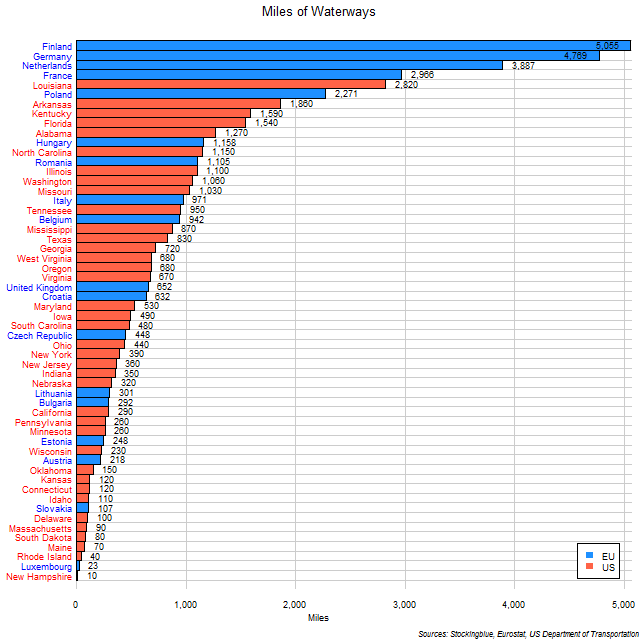
The chart above shows the length of waterways in EU and US states. Finland not only tops the chart but accounts for one-tenth of the total waterways in the EU and the US.
Per Capita Rail Coverage in EU and US Regions
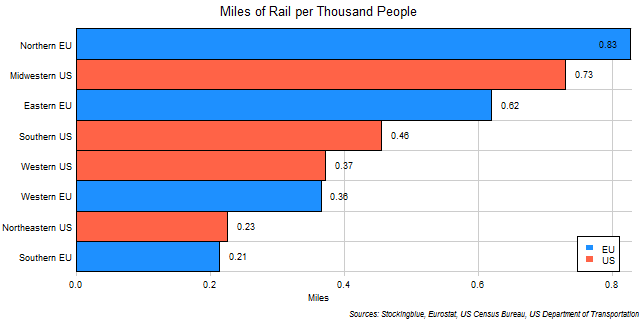
The chart above shows miles of rail per thousand people in EU and US regions. It's rare to see the EU and US regions be so similar to each other. Usually, the regions of one superstate clump together but in this metric there is a weaving back and forth between EU and US regions.
Per Capita Rail Coverage in EU and US States
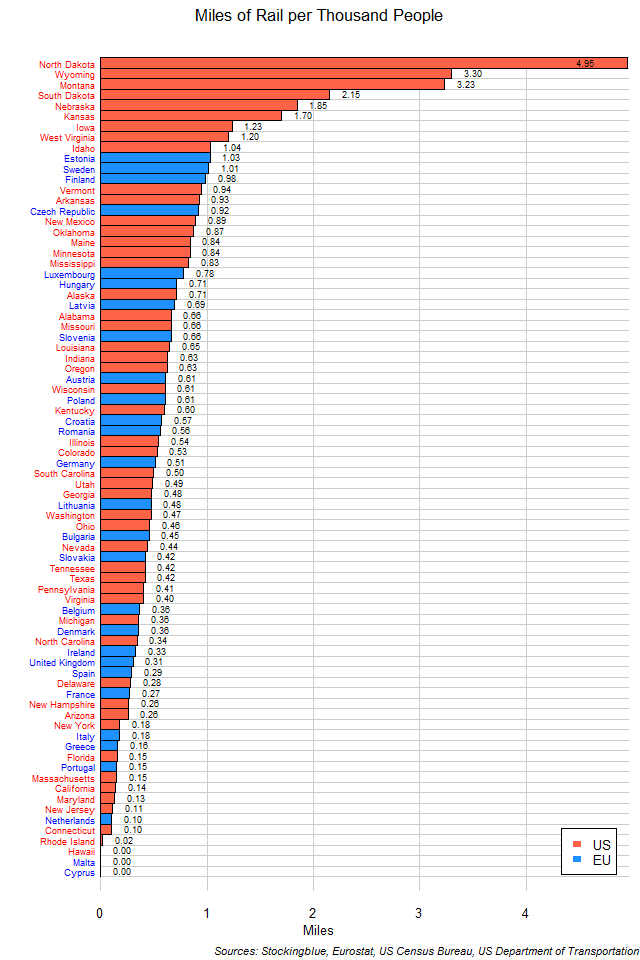
The chart above shows miles of rail per thousand people in EU and US states. Surprisingly it is US states that lead in this metric and US states are the only ones with over two miles of track for every thousand residents.
Per Capita Road Coverage in EU and US Regions
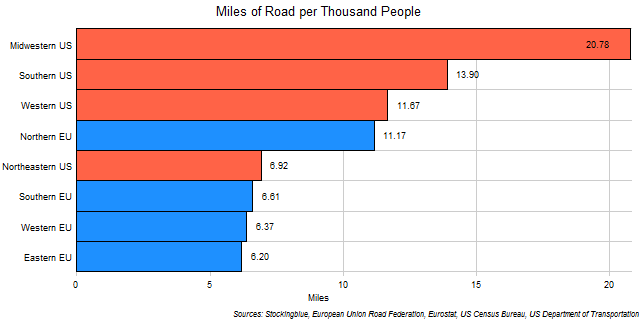
The chart above shows road lengths per thousand people in EU and US regions. With the exception of the Northeastern US, every single US region bests every single EU region in this metric. The Northern EU is the only EU region to rank higher than a US region.
OlderNewer