EU Regions by Gross Domestic Product
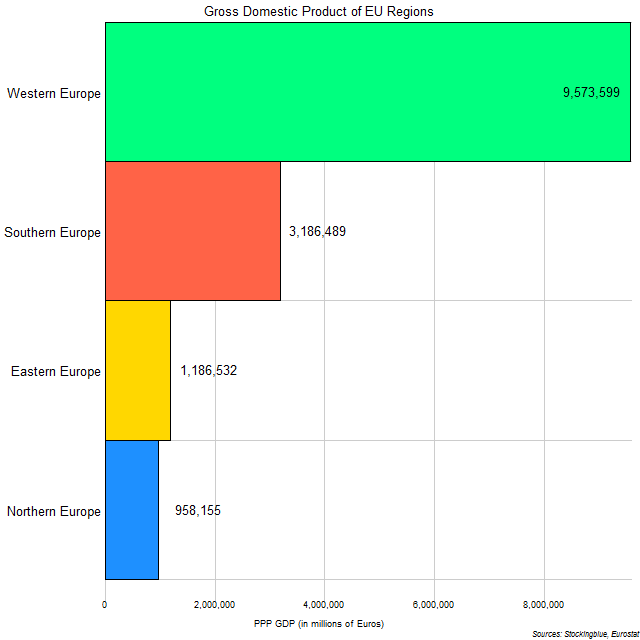
The chart above shows the regional economies of the European Union. The largest regional economy, Western Europe completely dominates the EU's economy.
US Regions by Gross Domestic Product
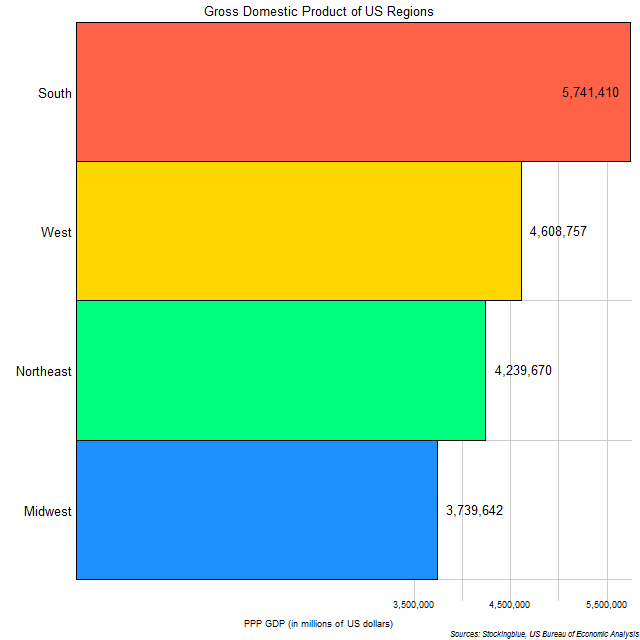
The chart above shows the regional economies of the United States. The largest regional economy, the South, includes 14 states.
A Look Back at Treasuries in 2017
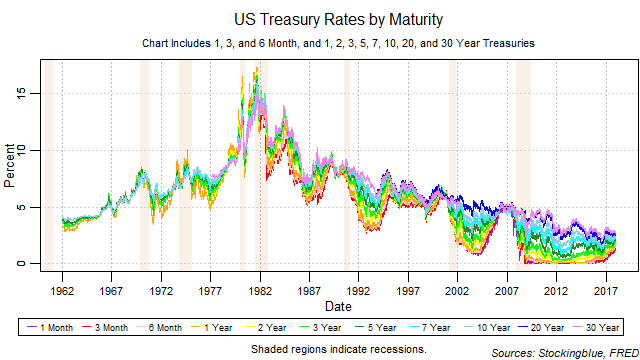
Short-term rates took a dramatic turn upwards after being stuck at zero for several years while long-term rates continued their slow and steady decline. The yield curve continued to narrow but it also narrowed from the bottom up. A narrowing from the short-term is a warning sign for an inversion that indicates recession.
Treasury Rate Movements, December 2017
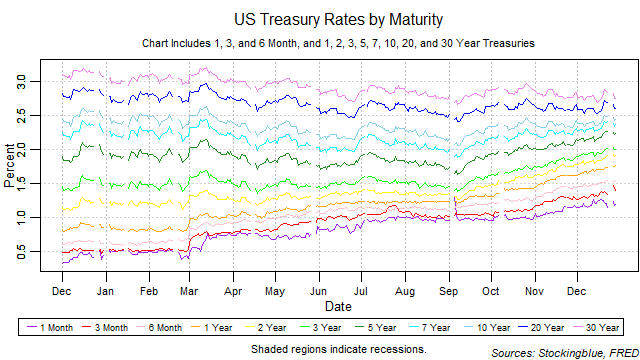
Short-term rates and medium-term rates continued to rise in December while long-term rates dropped from the previous month. The yield curve continued to narrow as it had in the previous month. Short-term rates have increased their rise in rates but the one-month bill had no sessions with higher rates than the three-month bill. That is, the one-month bill maintained the lowest rate throughout the month. However, the yield curve narrowed from both the short and long-term. A narrowing from the short-term is a warning sign for an inversion that indicates recession.
EU and US Cities and States Ranked by Gross Domestic Product
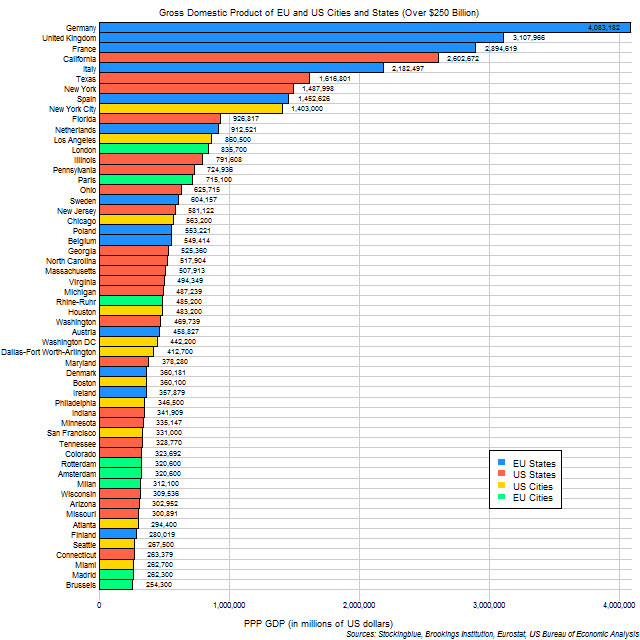
The chart above shows the state and city economies of both the European Union and the United States with GDPs over $250 billion. The EU has the largest state economy but the US has the largest city economy. Below, the remaining states and metropolitan areas that are amongst the 300 largest metropolitan economies in the world with GDPs under $250 billion.
US Cities and States Ranked by Gross Domestic Product
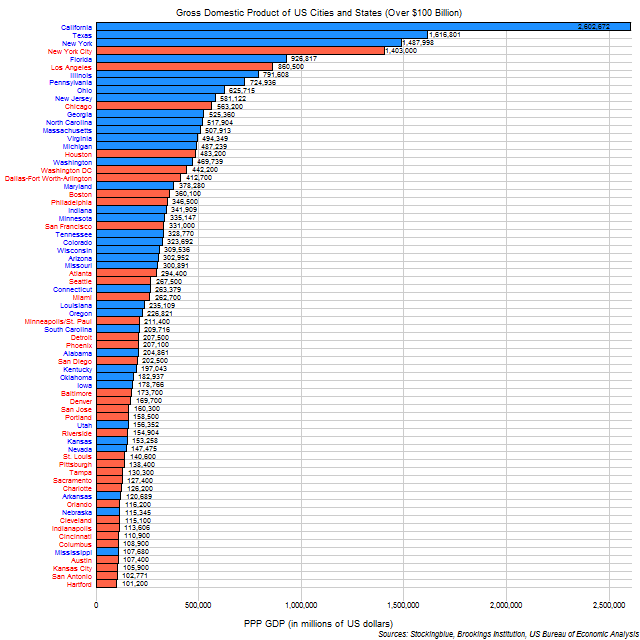
The chart above shows the state and city economies of the United States with GDPs over $100 billion. The largest metropolitan economy, New York City, would rank fourth if it were a state. Below, the remaining states and metropolitan areas that are amongst the 300 largest metropolitan economies in the world with GDPs under $100 billion.
EU Cities and States Ranked by Gross Domestic Product
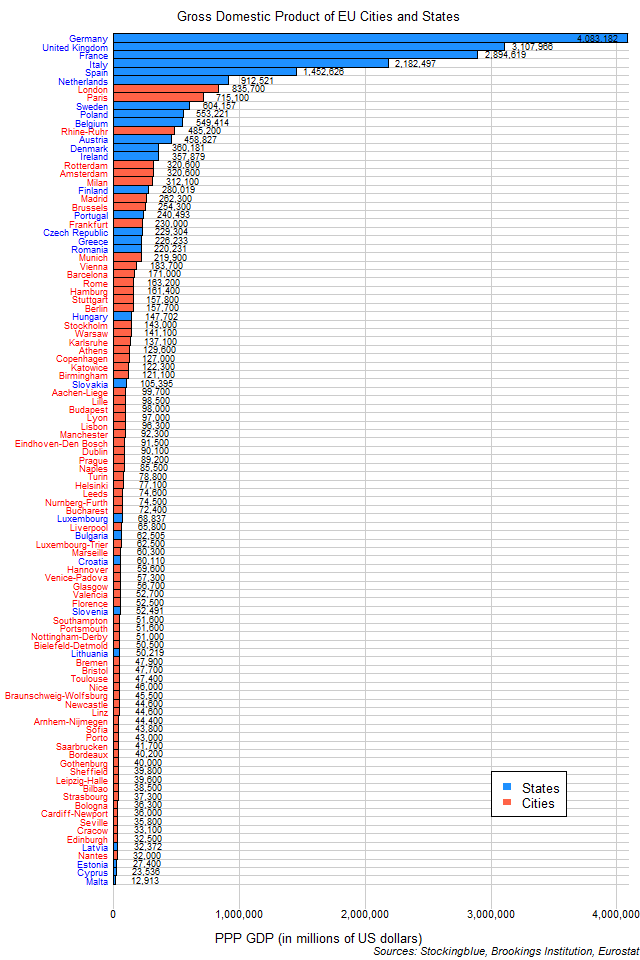
The chart above shows the state and city economies of the European Union. The largest metropolitan economy, London, would rank seventh if it were a state. The list only includes the metropolitan areas that are amongst the 300 largest metropolitan economies in the world.
EU and US States Ranked by Gross Domestic Product
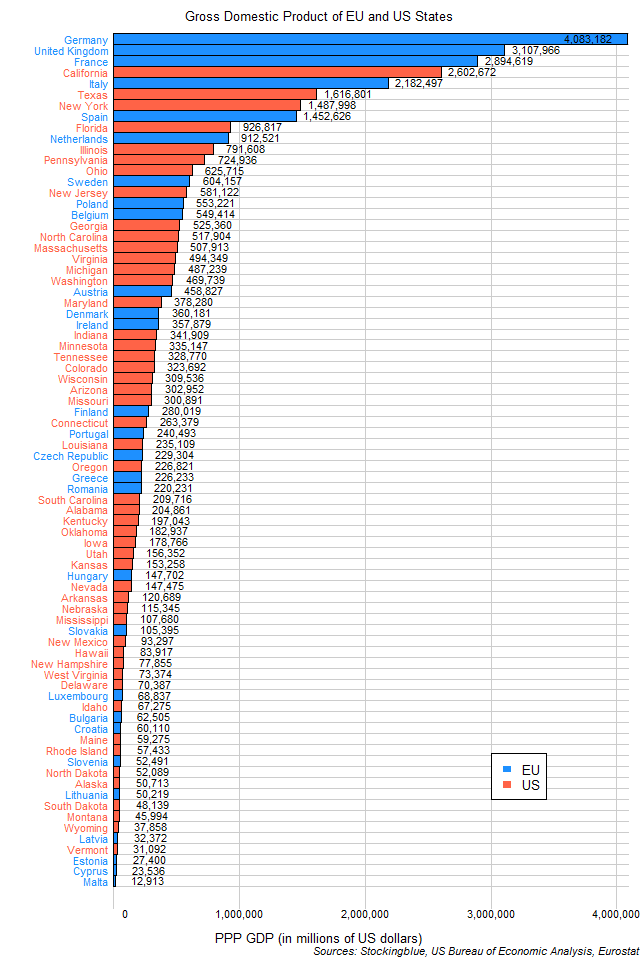
The chart above shows the state economies of the EU and US. The European Union has the three largest economies as well as the three smallest. Quite a feat considering there are nearly half as many EU states as there are in the US.
US States Ranked by Gross Domestic Product
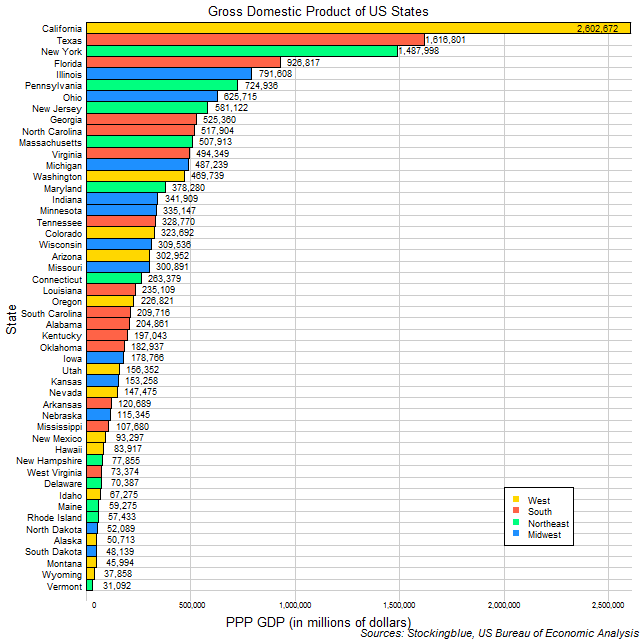
The chart above shows the state economies of US states. California dwarfs nearly every other state, and with the exception of Texas and New York, California's GDP is more than double of any of the largest state economies.
The Largest National Economies in the EU
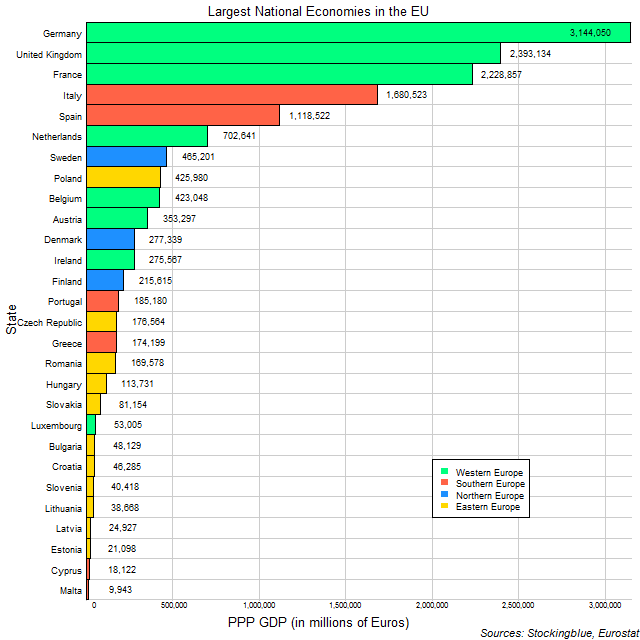
The chart above shows the largest national economies in the EU. Clearly, Western Europe dominates the EU with the top three economies all coming from the region and claiming four of the top six largest economies.
OlderNewer